Transcription of Hurricane Harvey
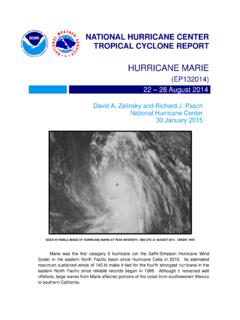
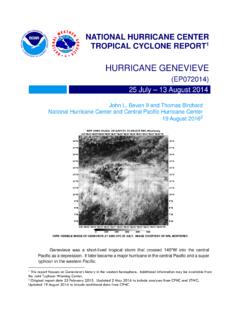
1 + NATIONAL Hurricane CENTER TROPICAL CYCLONE REPORT Hurricane Harvey (AL092017) 17 August 1 September 2017 Eric S. Blake and David A. Zelinsky National Hurricane Center 9 May 20181 NASA TERRA MODIS INFRARED IMAGE OF Harvey AT 0419 UTC 26 AUGUST 2017 JUST AFTER LANDFALL AS A CATEGORY 4 Hurricane IN TEXAS. IMAGE COURTESY OF UW/CIMSS. Harvey started as a typical weak August tropical storm that affected the Lesser Antilles and dissipated over the central Caribbean Sea. However, after re-forming over the Bay of Campeche, Harvey rapidly intensified into a category 4 Hurricane (on the Saffir-Simpson Hurricane Wind Scale) before making landfall along the middle Texas coast. The storm then stalled, with its center over or near the Texas coast for four days, dropping historic amounts of rainfall of more than 60 inches over southeastern Texas.
2 These rains caused catastrophic flooding, and Harvey is the second-most costly Hurricane in history, after accounting for inflation, behind only Katrina (2005). At least 68 people died from the direct effects of the storm in Texas, the largest number of direct deaths from a tropical cyclone in that state since 1919. 1 Original report date 23 January. Updated Montgomery county damage, tornado totals, corrected some typos, and added a picture of Nederland, Texas, rain gauge location. Hurricane Harvey 2 Hurricane Harvey 17 AUGUST 1 SEPTEMBER 2017 SYNOPTIC HISTORY The wave that spawned Harvey moved off the west coast of Africa on 12 August with a large convective mass that had mostly dissipated by late the next day.
3 Convection increased near the wave axis on 15 August, likely due to the passage of a convectively coupled Kelvin wave early that day (Fig. 1). A low pressure center formed early on 16 August, but easterly shear initially prevented any organization of the associated convection. The shear relaxed overnight, allowing deep convection to build near the center, and a tropical depression formed around 0600 UTC 17 August about 440 n mi east of Barbados. The depression became a tropical storm 12 h later. The best track chart of Harvey s path is given in Fig. 2, with the wind and pressure histories shown in Figs. 3 and 4, respectively. The best track positions and intensities are listed in Table 12. Harvey moved quickly westward, south of a western Atlantic ridge, reaching an initial peak intensity of 40 kt early on 18 August.
4 The storm s center passed over Barbados at 1000 UTC that day and St. Vincent five hours later, although most of the strong winds occurred away from those islands to the north of the center. Increasing northerly wind shear caused Harvey to gradually weaken back to a depression early on 19 August and to degenerate into a tropical wave by 1800 UTC that day over the central Caribbean Sea. The remnants of Harvey moved rapidly to the west and west-northwest for the next couple of days, staying convectively active while they moved over the Yucatan Peninsula on 22 August. A low pressure area formed late that day in association with a short-lived burst of deep convection. The low moved west-northwestward into the Bay of Campeche early on 23 August and, shortly after 0600 UTC, more persistent deep convection increased near the low.
5 By 1200 UTC, an Air Force Reserve reconnaissance aircraft found that the circulation of the low had become better-defined, indicating that Harvey had regenerated into a tropical depression when its center was located about 150 n mi west of Progreso, Mexico. Initially, the depression was poorly organized with a large radius-of-maximum winds (RMW). This structure did not last for long as a smaller RMW formed, possibly due to concentrated deep convection near the center. Harvey began to rapidly intensify late on 23 August in an environment of light shear, very warm water and high mid-level moisture. The storm turned northward, steered around the western edge of the distant subtropical ridge, and the track gradually bent toward the northwest during the next day or two.
6 The cyclone s rate of intensification increased early on 24 August as a large mass of deep convection formed over the center, and an eye was noted on reconnaissance observations by 1200 UTC that day. Harvey 2 A digital record of the complete best track, including wind radii, can be found on line at Data for the current year s storms are located in the btk directory, while previous years data are located in the archive directory. Hurricane Harvey 3 became a Hurricane later on 24 August, and by that night a well-defined eye appeared in infrared satellite pictures. The Hurricane reached category 3 status by midday on 25 August while it approached the middle Texas coast and intensified into a category 4 Hurricane by 0000 UTC 26 August.
7 Harvey s center made landfall on the northern end of San Jose Island about 5 n mi east of Rockport, Texas at 0300 UTC that day. Sustained winds of 115 kt and a minimum central pressure of 937 mb are estimated for that landfall. The Hurricane then made a second landfall on the Texas mainland 3 h later, slightly weaker due to land interaction, with 105 kt winds and an estimated central pressure of 948 mb southeast of Refugio on the northeast coast of Copano Bay west of Holiday Beach. Harvey rapidly weakened over land to a tropical storm within 12 h after landfall and maintained a 35-kt intensity for the next day or so, aided by the sustaining effects of the southeastern portion of its circulation remaining over water. The steady northwestward motion of the cyclone stopped as Harvey became embedded in light steering currents between one mid-tropospheric high over the Four Corners region and another high over the northern Gulf of Mexico.
8 The storm made a slow loop late on 26 August into 27 August, and drifted eastward or southeastward for the next few days. Although the center passed well south of the houston Metro and Golden Triangle (southeastern Texas between Beaumont, Port Arthur and Orange) areas, torrential rains fell in these locations near a stationary front on the north and east side of Harvey (see Figs. 12-15). The storm center moved back offshore around 0300 UTC 28 August over Matagorda Bay, its winds slightly re-strengthening with deep convection reforming near and north of the center. However, the vertical wind shear was too strong for much intensification, and Harvey reached a final peak intensity of 45 kt late on 29 August. By that time, the storm turned to the north-northeast due to a strengthening ridge over the western Atlantic, its center never having moved more than 60 n mi offshore of the Texas Coast.
9 Extremely heavy rains, however, continued on the north and northwest side of the tropical cyclone, most concentrated then near the Beaumont-Port Arthur area. Harvey made its final landfall in southwestern Louisiana at 0800 UTC 30 August near Cameron with 40-kt sustained winds. Thereafter, the cyclone slowly weakened over land, becoming a tropical depression late on 30 August. Harvey then moved northeastward over the southern United States while producing heavy rainfall, and it transformed into an extratropical cyclone by 0600 UTC 1 September over the Tennessee Valley. The cyclone dissipated over northern Kentucky late the next day. METEOROLOGICAL STATISTICS Observations in Harvey (Figs. 3 and 4) include subjective satellite-based Dvorak technique intensity estimates from the Tropical Analysis and Forecast Branch (TAFB) and the Satellite Analysis Branch (SAB), and objective Advanced Dvorak Technique (ADT) estimates from the Cooperative Institute for Meteorological Satellite Studies/University of Wisconsin-Madison.
10 Observations also include flight-level, stepped frequency microwave radiometer (SFMR), and dropwindsonde observations from 21 flights of the 53rd Weather Reconnaissance Squadron of the U. S. Air Force Reserve Command and the NOAA Hurricane Hunters. Data and imagery from NOAA polar-orbiting satellites including the Advanced Microwave Sounding Unit (AMSU), the Hurricane Harvey 4 NASA Global Precipitation Mission (GPM), the European Space Agency s Advanced Scatterometer (ASCAT), and Defense Meteorological Satellite Program (DMSP) satellites, among others, were also useful in constructing the best track of Harvey . Ship reports of winds of tropical storm force associated with Harvey are given in Table 2, and selected surface observations from land stations and data buoys are given in Table 3.