Transcription of Hurricane Marie
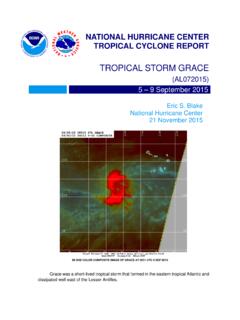
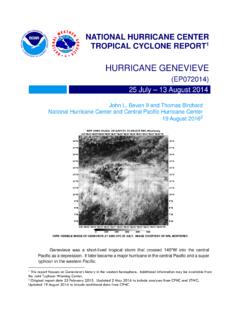
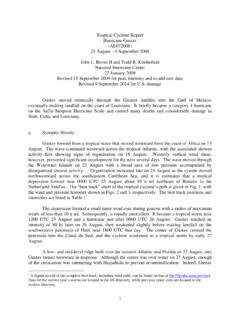
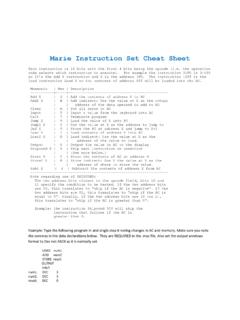
1 NATIONAL Hurricane CENTER TROPICAL CYCLONE REPORT Hurricane Marie (EP132014) 22 28 August 2014 David A. Zelinsky and Richard J. Pasch National Hurricane Center 30 January 2015 GOES-W VISIBLE IMAGE OF Hurricane Marie AT PEAK INTENSITY, 1800 UTC 24 AUGUST 2014. CREDIT: NHC Marie was the first category 5 Hurricane (on the Saffir-Simpson Hurricane Wind Scale) in the eastern North Pacific basin since Hurricane Celia in 2010. Its estimated maximum sustained winds of 140 kt make it tied for the fourth strongest Hurricane in the eastern North Pacific since reliable records began in 1988. Although it remained well offshore, large waves from Marie affected portions of the coast from southwestern Mexico to southern California. Hurricane Marie 2 Hurricane Marie 22 28 AUGUST 2014 SYNOPTIC HISTORY Hurricane Marie developed from a tropical wave that crossed the coast of Africa and entered the eastern tropical Atlantic on 10 August (Fig.)
2 1). Although the wave was associated with a distinct low- to mid-level vorticity maximum and moist air near the wave axis, strong easterly shear and entrainment of dry environmental air prevented development of the system over the eastern and central tropical Atlantic. The wave entered the Caribbean Sea on 16 August, at which time interactions with South America and an upper-level trough further inhibited development. The wave crossed Central America around 19 August and subsequently moved into a far more conducive environment for development in the eastern North Pacific. The favorable environment supported persistent widespread convection that led to the development of a large but disorganized area of low pressure by early 20 August. Deep convection gradually became better organized during the next two days, resulting in the development of curved bands of showers and thunderstorms late on 21 August. A well-defined low-level circulation became apparent around 0000 UTC 22 August, marking the formation of a tropical depression centered about 320 n mi south-southeast of Acapulco, Mexico.
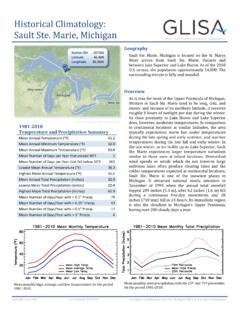
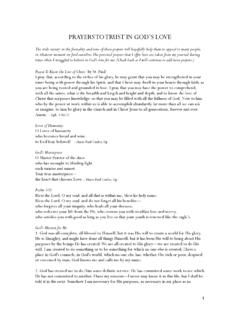
3 The best track chart of the tropical cyclone s path is given in Fig. 2, with the wind and pressure histories shown in Figs. 3 and 4, respectively. The best track positions and intensities are listed in Table 11. The newly formed depression remained embedded within a very favorable environment of low vertical wind shear, high moisture, and sea surface temperatures (SSTs) near 30 C. This led to a remarkable 66-h period of rapid intensification between 0000 UTC 22 August and 1800 UTC 24 August, during which the intensity increased by an estimated 110 kt. Marie strengthened by 60 kt during the final 24 h of this period, reaching an estimated peak intensity of 140 kt around 1800 UTC 24 August, while centered about 500 n mi south-southwest of Cabo San Lucas, Mexico. Marie was the first category 5 Hurricane in the eastern North Pacific basin since Hurricane Celia in 2010. Aside from a trochoidal wobble on 24 August, Marie moved on a fairly consistent west-northwestward to northwestward heading at about 12 to 14 kt throughout most of its duration as a tropical cyclone.
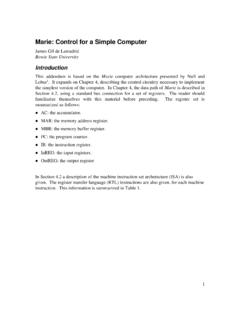
4 After genesis, the cyclone was steered primarily by a large deep-layer ridge centered over the southern United States. As Marie moved around the periphery of the ridge, the ridge built westward over the southwestern United States and northern Mexico, resulting in a nearly constant steering flow through much of the tropical cyclone s existence. An eyewall replacement that began on 24 August ended the rapid intensification and induced a steady weakening trend. Microwave imagery on 25 and 26 August (Fig. 5) show that 1 A digital record of the complete best track, including wind radii, can be found on line at Data for the current year s storms are located in the btk directory, while previous years data are located in the archive directory. Hurricane Marie 3 the inner core of Marie featured concentric eyewalls, likely the primary factor in the weakening of the cyclone during that time.
5 By late on 26 August, the eyewall began to open up in the northeast quadrant, indicative of further weakening. In addition, Marie began moving over a strong SST gradient, resulting in rapidly decreasing SSTs and a more stable thermodynamic environment. By 1800 UTC 27 August, Marie weakened to tropical storm intensity, and the inner core became devoid of deep convection shortly thereafter. Although shower activity persisted in bands over the southern portions of the circulation for another day, by 1800 UTC 29 August, the system lacked sufficient deep convection to be classified as a tropical cyclone. On 30 August the remnant low became embedded within weaker low-level easterly flow and slowed considerably while spinning down over the course of several days. A well-defined low-level center was no longer present after 0600 UTC 2 September. METEOROLOGICAL STATISTICS Observations in Marie (Figs. 2 and 3) include subjective satellite-based Dvorak technique intensity estimates from the Tropical Analysis and Forecast Branch (TAFB) and the Satellite Analysis Branch (SAB), and objective Advanced Dvorak Technique (ADT) estimates from the Cooperative Institute for Meteorological Satellite Studies/University of Wisconsin-Madison.
6 Data and imagery from NOAA polar-orbiting satellites including the Advanced Microwave Sounding Unit (AMSU), the NASA Tropical Rainfall Measuring Mission (TRMM), the European Space Agency s Advanced Scatterometer (ASCAT), and Defense Meteorological Satellite Program (DMSP) satellites, among others, were also useful in constructing the best track of Marie . Marie s estimated peak intensity of 140 kt is based on subjectively derived T-numbers of from TAFB and SAB at 1800 UTC 24 August. A maximum objective ADT estimate of and an AMSU intensity estimate of 143 kt within 6 h of 1800 UTC also support the peak intensity of 140 kt. Interestingly, Marie s estimated minimum pressure of 918 mb is tied for the lowest of the season with Hurricane Odile, which developed only 8 days after the dissipation of Marie . In addition to its extreme intensity, Marie was a very large Hurricane . At its largest, Marie s tropical-storm-force winds extended nearly 500 n mi across, with a maximum radial extent of 270 n mi in the northeastern quadrant.
7 Mid- and high-level moisture advected northward by Marie also contributed to heavy rains, flooding, and mud slides in several Mexican states. There were no ship reports of tropical-storm-force winds associated with Marie . Hurricane Marie 4 CASUALTY AND DAMAGE STATISTICS Marie is believed to have caused four direct deaths2. Although Marie remained well offshore, large swells generated by the Hurricane affected portions of the Mexican and southern California coastlines for several days. In Malibu, California, a surfer drowned in the high surf. In Mexico, a vessel with seven fishermen aboard capsized when it was hit by high waves near Cabo San Lucas. Although four of the fishermen were able to swim to shore, three went missing and are presumed to have drowned. In the United States, damages totaled close to $20 million. Media reports indicated that nearly $16 million in damage occurred in and around the Port of Long Beach, where waves breached a major breakwater in multiple locations.
8 Catalina Island was estimated to have sustained at least $3 million in damage. In addition, waves of 10 to 15 feet damaged boatyards and caused the shutdown of the Malibu Pier after several pilings were damaged. FORECAST AND WARNING CRITIQUE The formation of Marie was well forecast. Ninety-six hours prior to genesis, the Tropical Weather Outlook (TWO) stated that there was a medium chance of tropical cyclone formation to the south of Mexico, while the wave from which Marie developed was still located over the western Caribbean. The likelihood of tropical cyclone formation was increased to a high chance of formation in the five-day TWO 78 hours prior to the development of a tropical depression. Table 2 shows the number of hours in advance of formation that each likelihood category was first introduced into the TWO. A verification of NHC official track forecasts for Marie is given in Table 3a. Official forecast track errors were lower than the mean official errors for the previous 5-yr period.
9 A homogeneous comparison of the official track errors with selected guidance models is given in Table 3b. The relatively simple synoptic steering pattern and straight-line track of Marie contributed to the extremely low errors in the official track forecasts. Most of the guidance had similarly low errors, and the multi-model consensus, TVCN, was slightly better than the official track forecast at all forecast intervals. For example, although the average 48-h official track forecast error was a remarkably low 28 n mi, the TVCN error was a mere 26 n mi. A verification of NHC official intensity forecasts for Marie is given in Table 4a. The mean official forecast intensity errors were generally comparable to the mean official errors for the previous 5-yr period except at 120 h. A homogeneous comparison of the official intensity errors with selected guidance models is given in Table 4b. Although the first several official intensity 2 Deaths occurring as a direct result of the forces of the tropical cyclone are referred to as direct deaths.
10 These would include those persons who drowned in storm surge, rough seas, rip currents, and freshwater floods. Direct deaths also include casualties resulting from lightning and wind-related events ( , collapsing structures). Deaths occurring from such factors as heart attacks, house fires, electrocutions from downed power lines, vehicle accidents on wet roads, etc., are considered indirect deaths. Hurricane Marie 5 forecasts failed to capture the full magnitude of the rapid intensification of Marie (Fig. 6), these forecasts still captured the intensification better than most of the guidance, which failed to show the same increase in wind speeds. The official forecasts were aided by the SHIPS Rapid Intensification Index, which indicated probabilities as high as 64% of a 30-kt or greater increase in winds over 48 h during the first four forecast cycles. The official forecasts were generally too slow to weaken Marie after its peak intensity, while several models captured the timing and rate of the weakening fairly well.