Transcription of Hurricane Maria
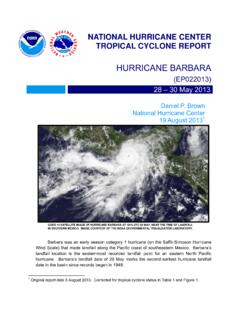
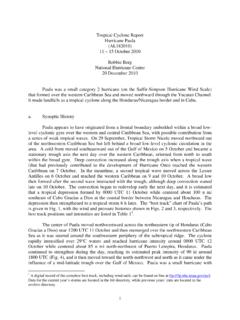
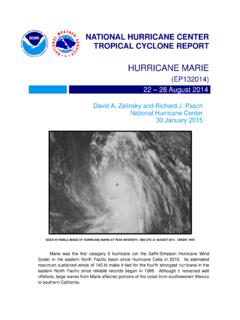
1 NATIONAL Hurricane CENTER TROPICAL CYCLONE REPORT Hurricane Maria (AL152017) 16 30 September 2017 Richard J. Pasch, Andrew B. Penny, and Robbie Berg National Hurricane Center 14 February 20191 VIIRS SATELLITE IMAGE OF Hurricane Maria NEARING PEAK INTENSITY AT 1942 UTC 19 SEPTEMBER 2017. IMAGE COURTESY OF UW-CIMSS. Maria was a very severe Cape Verde Hurricane that ravaged the island of Dominica at category 5 (on the Saffir-Simpson Hurricane Wind Scale) intensity, and later devastated Puerto Rico as a high-end category 4 Hurricane . It also inflicted serious damage on some of the other islands of the northeastern Caribbean Sea. Maria is the third costliest Hurricane in United States history. 1 Original report date 5 April 2018. Second version on 10 April 2018 corrected damage photo of Dominica in Fig. 9. This version corrects best track latitude and longitude values in Table 1 at 0000 UTC 21 September 2017, 0600 UTC 29 September 2017, and 1200 UTC 29 September 2017.
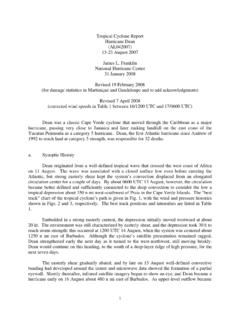
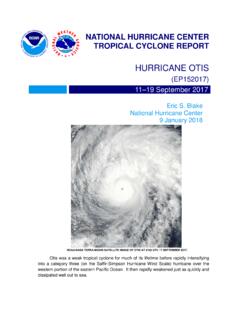
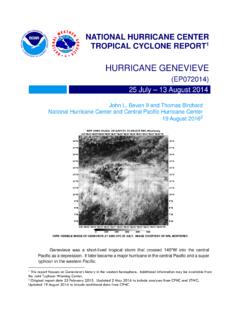
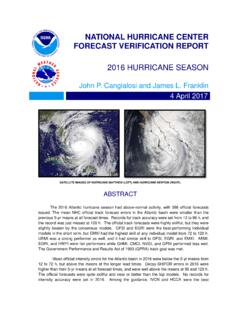
2 Hurricane Maria 2 Hurricane Maria 16 30 SEPTEMBER 2017 SYNOPTIC HISTORY Maria originated from a well-defined tropical wave that departed the west coast of Africa on 12 September. The system moved westward over the tropical Atlantic for the next few days while producing scattered and disorganized deep convection. By 15 September, showers and thunderstorms increased and began to show signs of organization, with some curved cloud bands developing. Deep convection then quickly became more consolidated and better organized, and it is estimated that a tropical depression formed about 580 n mi east of Barbados by 1200 UTC 16 September. The best track chart of the tropical cyclone s path is given in Fig. 1, with the wind and pressure histories shown in Figs. 2 and 3, respectively. The best track positions and intensities are listed in Table 12. Moving westward to the south of a mid-level high pressure area, the cyclone strengthened into a tropical storm around 1800 UTC on 16 September.
3 Maria turned toward the west-northwest shortly thereafter, and quickly intensified into a Hurricane by 1800 UTC on 17 September. While situated in an environment of warm sea surface temperatures and light vertical shear, the Hurricane strengthened extremely rapidly. Maria became a 100-kt major Hurricane by 1200 UTC 18 September, and just 12 h later, as it neared Dominica, it became a category 5 Hurricane with maximum winds of 145 kt. The Hurricane made landfall on the island with that intensity and an estimated minimum central pressure of 922 mb around 0115 UTC 19 September. After striking Dominica, Maria continued moving west-northwestward and entered the northeastern Caribbean Sea. Slight weakening had occurred due to the system s interaction with the mountainous island of Dominica, but the Hurricane soon regained intensity and strengthened to its peak intensity of 150 kt with a minimum pressure of 908 mb around 0300 UTC 20 September while centered about 25 n mi south of St.
4 Croix. Maria moved west-northwestward to northwestward toward Puerto Rico and, after reaching maximum intensity, underwent an eyewall replacement with an outer eyewall becoming more dominant by the time the center of the system reached Puerto Rico (Figures 4a and 4b). The Hurricane weakened somewhat before its landfall on that island due to the eyewall replacement, but also grew in size. Maria s center crossed the southeast coast of Puerto Rico near Yabucoa around 1015 UTC 20 September, and the Hurricane s maximum winds at that time were near 135 kt, , just below the threshold of category 5 intensity. The Hurricane s center crossed the island, roughly diagonally from southeast to northwest, for several hours and emerged into the Atlantic around 1800 UTC 20 September. By that time, Maria had weakened after interacting with the land mass of Puerto Rico and its maximum winds were estimated to be 95 kt. 2 A digital record of the complete best track, including wind radii, can be found on line at Data for the current year s storms are located in the btk directory, while previous years data are located in the archive directory.
5 Hurricane Maria 3 Over the next couple of days, the Hurricane moved northwestward along the southwestern periphery of a mid-level high over the western Atlantic while gradually restrengthening. Although Maria never regained all of its former intensity, its maximum winds increased to near 110 kt by 0000 UTC 22 September while the Hurricane was centered about 60 n mi southeast of Grand Turk Island. Maria turned toward the north-northwest, and its center passed 30 to 40 n mi east and northeast of the Turks and Caicos Islands on 22 September. Moderate southwesterly vertical shear prevented any additional strengthening during that period. The system maintained major Hurricane status until 0600 UTC 24 September, while turning toward the north. Maria continued to gradually weaken, and it lost its eyewall structure by 25 September while continuing northward at a slow forward speed well offshore of the southeastern coast. The cyclone then weakened to category 1 status, and by 0600 UTC 27 September the center of the 65-kt Hurricane passed about 130 n mi east of Cape Hatteras, North Carolina.
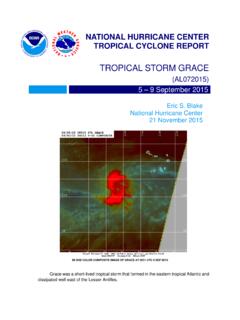
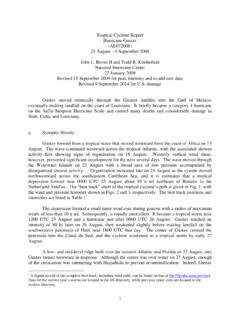
6 On 28 September, Maria turned sharply toward the east and began to accelerate as it weakened to a tropical storm. Moving rapidly eastward to east-northeastward, the system became an extratropical cyclone by 1800 UTC 30 September while centered about 465 n mi southeast of Cape Race, Newfoundland. The cyclone moved east-northeastward until dissipation over the north Atlantic about 400 n mi southwest of Ireland by 1800 UTC 2 October. METEOROLOGICAL STATISTICS Observations in Maria (Figs. 2 and 3) include subjective satellite-based Dvorak technique intensity estimates from the Tropical Analysis and Forecast Branch (TAFB) and the Satellite Analysis Branch (SAB), and objective Advanced Dvorak Technique (ADT) estimates from the Cooperative Institute for Meteorological Satellite Studies/University of Wisconsin-Madison. Observations also include flight-level, stepped frequency microwave radiometer (SFMR), and dropwindsonde observations from 22 flights of the 53rd weather Reconnaissance Squadron of the Air Force Reserve Command, and 8 flights of the noaa Hurricane Hunter P-3 aircraft.
7 Data and imagery from noaa polar-orbiting satellites including the Advanced Microwave Sounding Unit (AMSU), the NASA Global Precipitation Mission (GPM), the European Space Agency s Advanced Scatterometer (ASCAT), and Defense Meteorological Satellite Program (DMSP) satellites, among others, were also useful in constructing the best track of Maria . Ship reports of winds of tropical storm force associated with Maria are given in Table 2, and selected surface observations from land stations and data buoys are given in Table 3. Winds and Pressure Maria s peak intensity of 150 kt is based on a blend of SFMR-observed surface winds of 152 kt and 700-mb flight-level winds of 157 kt. Maria s 65-kt intensity increase over 24 h on 18 September makes it tied for the sixth-fastest intensifying Hurricane in the Atlantic basin record. The intensity of the Hurricane when it struck Dominica, 145 kt, is based on an SFMR-observed surface wind of 152 kt which, based on quality control by data processing software, is believed to be somewhat inflated, and a maximum 10-min wind of 130 kt measured at Douglas- Hurricane Maria 4 Charles Airport on the island, which conservatively corresponds to a 1-min wind of 143 kt.
8 Maria is the strongest Hurricane on record to make landfall on Dominica (or strike within 60 n mi of that island). Maria s minimum central pressure of 908 mb is based on an eye dropsonde measurement by the Air Force Hurricane Hunters of 910 mb with 23-kt winds at the surface at 0313 UTC 20 September. This is the lowest pressure on record of any Hurricane in the Atlantic basin east of 70 W, and breaks the record that had been set just a couple of weeks earlier by Irma of 914 mb. The landfall intensity of the cyclone in Puerto Rico, 135 kt, is based on an extrapolation of the weakening trend noted in the aircraft data after the eyewall replacement began several hours earlier. There were no believable Doppler-derived winds from the San Juan WSR-88D radar that supported a higher intensity. It should be noted, however, that in Puerto Rico, winds of category 5 intensity were almost certainly felt at some elevated locations on the island. The landfall pressures of the Hurricane in Dominica and Puerto Rico of 922 and 920 mb, respectively, are based on an extrapolation of the system s deepening and filling trends before making landfall in those islands.
9 Several storm chasers observed pressures higher than the estimated minimum value in Puerto Rico, but these observers were not thought to be in the exact center of the Hurricane . Maria is the strongest Hurricane to make landfall in Puerto Rico since a category 5 Hurricane in 1928 (known as Segundo San Felipe). Maria s eyewall replacement early on 20 September resulted in roughly a tripling of its eye diameter, from 9 n mi to about 28 n mi, prior to landfall in Puerto Rico. This event was likely a major contributor to weakening, but also increased the areal exposure of the island to the Hurricane s highest winds. A peak sustained wind of 93 kt with a gust to 119 kt was reported at St. Croix near the northeast edge of Maria s eyewall. Las Mareas, on the south coast of Puerto Rico, recorded a 1-min sustained wind of 94 kt with a gust to 109 kt in the western eyewall of Maria . Wind gusts to Hurricane force were recorded in Guadeloupe and on the northeast coast of the Dominican Republic.
10 Sustained winds at the low end of tropical storm force occurred over the North Carolina Outer Banks due to Maria . It should be noted that in Figure 2, beginning around 24 September, Maria s actual maximum winds were as much as 20-30 kt lower than what would be derived from a standard pressure-wind relationship [AC(DVK->W)]. This is mainly due to the expansion of the cyclone s circulation while it moved into higher latitudes. Hurricane Maria 5 Storm Surge3 The combined effect of the surge and tide produced maximum inundation levels of 6 to 9 ft above ground level to the north of Maria s landfall along the coasts of Humacao, Naguabo, and Ceiba municipalities in Puerto Rico. Figure 5 provides an analysis of maximum inundation heights along the coasts of Puerto Rico and the Virgin Islands, and Figure 6 provides peak water levels recorded by tide gauges, relative to Mean Higher High Water (MHHW). The United States Geological Survey (USGS) measured high water marks of ft and ft above ground level inside structures at Punta Santiago in Humacao.