Transcription of Hurricane Matthew
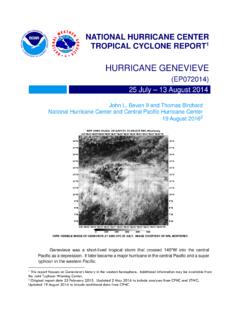
1 NATIONAL Hurricane CENTER. TROPICAL CYCLONE REPORT. Hurricane Matthew . (AL142016). 28 September 9 October 2016. Stacy R. Stewart National Hurricane Center 7 April 20171. MIMIC MICROWAVE SATELLITE IMAGE OF Matthew AS THE EYE OF THE POWERFUL Hurricane WAS MAKING. LANDFALL NEAR LES ANGLAIS, HAITI, AT 1100 UTC 4 OCTOBER 2016. IMAGE COURTESY OF UW-CIMSS WISCONSIN. Matthew was a category 5 Hurricane (on the Saffir-Simpson Hurricane Wind Scale). that later made landfalls as a major Hurricane along the coasts of southwestern Haiti, extreme eastern Cuba, and western Grand Bahama Island, and as a category 1 Hurricane along the central coast of South Carolina.
2 Matthew was responsible for 585 direct deaths, with more than 500 deaths occurring in Haiti, making it the deadliest Atlantic Hurricane since Hurricane Stan in 2005. Matthew reached category 5 intensity at the lowest latitude ever recorded in the Atlantic Basin. 1 Original report date 3 April 2017. Revised on 7 April 2017 to update United States and North Carolina casualties. Hurricane Matthew 2. Hurricane Matthew 28 SEPTEMBER 9 OCTOBER 2016. SYNOPTIC HISTORY. A vigorous tropical wave exited the west coast of Africa early on 23 September and moved westward across the tropical Atlantic at forward speeds of 20-25 kt for the next three days.
3 The fast-moving, low-latitude disturbance generally remained south of 10O N latitude until 26. September, when it slowed down and turned toward the west-northwest. Over the next couple of days, the disturbance's satellite cloud pattern gradually acquired the appearance of a tropical cyclone, an indication of the system's well-defined mid- and upper-level circulations. However, scatterometer wind data indicated that the tropical wave did not possess a closed surface circulation. This open-wave wind flow pattern was confirmed on 27 September when a Air Force Reserve Unit reconnaissance aircraft was unable to close off a surface circulation during its investigative mission.
4 However, aircraft data indicated that surface winds of near 40 kt were occurring on the north side of the wave. Early on 28 September when the system was passing just north of Barbados, radar imagery in the Lesser Antilles indicated that thunderstorm activity was becoming better organized, including pronounced curved convective bands near and to the north and northeast of the well-defined mid-level circulation center. Another Air Force Reserve Hurricane Hunter aircraft found a closed surface circulation and 50-kt surface winds around 1400. UTC that day. Based on the aircraft wind data and microwave satellite imagery (not shown), it is estimated that a tropical storm formed around 1200 UTC 28 September about 15 n mi west- northwest of Barbados.
5 The best track chart of the tropical cyclone's path is given in , with the wind and pressure histories shown in Figs. 2 and 3, respectively. The best track positions and intensities are listed in Table 12. Under the influence of a strong deep-layer ridge to its north, Matthew turned westward and moved across the Windward Islands, passing midway between St. Lucia and St. Vincent around 1800 UTC 28 September, and moved into the eastern Caribbean Sea 6 h later. The unusually large wind field on the east side of Matthew 's asymmetric circulation resulted in tropical- storm-force winds occurring on Barbados as late as 0000 UTC 29 September.
6 These conditions spread northward across most of the Lesser Antilles, with tropical-storm-force wind gusts occurring as far north as the Virgin Islands and Puerto Rico. As Matthew continued to move over the deep, warm waters of the Caribbean Sea, the tropical cyclone gradually strengthened within an environment of west-southwesterly 850 200-mb vertical wind shear of about 20 kt, and reached Hurricane status by 1800 UTC 29 September about 165 n mi northeast of Cura ao. Over the next 48 h, the ridging increased to the north and west of Matthew , forcing the Hurricane towards the west-southwest.
7 Despite moderate vertical wind shear of 15-20 kt, Matthew 2 A digital record of the complete best track, including wind radii, can be found on line at Data for the current year's storms are located in the btk directory, while previous years' data are located in the archive directory. Hurricane Matthew 3. underwent a 24-h period of rapid intensification (RI) between 0000 UTC 30 September and 0000. UTC 1 October, during which time Matthew 's eye diameter contracted from roughly 30 n mi to 5. n mi (Fig. 4). The Hurricane strengthened an extraordinary 75 kt, reaching an estimated peak intensity of 145 kt at 0000 UTC 1 October when located less than 80 n mi north of Punta Gallinas, Colombia.
8 This intensity made Matthew the southernmost category 5 Hurricane in the Atlantic basin, surpassing a record previously set by Hurricane Ivan in 2004. Almost immediately after Matthew reached its peak intensity, the powerful category 5. Hurricane began a slow weakening trend. Passive microwave satellite imagery never indicated that an eyewall replacement cycle (ERC) occurred during that weakening phase, and reconnaissance aircraft wind data confirmed that a secondary wind maximum or ERC did not develop. However, upwelling was occurring beneath the Hurricane as indicated by satellite- derived sea-surface temperature (SST) data and also SST data from NOAA buoy 42058.
9 The eye of Matthew passed directly over the buoy at approximately 0747 UTC 3 October, which recorded a pressure measurement of mb. However, the buoy's SST data (Fig. 5) indicate that upwelling and mixing reduced the SSTs beneath the Hurricane by more than 3OC. Oceanic cooling occurred at the buoy more than 12 h before Matthew 's eye passage, as a result of both the strength and size of the Hurricane 's wind field. The western portion of the subtropical ridge across Cuba and Hispaniola weakened early on 2 October, and the Hurricane made a small counter-clockwise loop and turned slowly northwestward within weak steering currents.
10 During that time, Matthew weakened to an estimated intensity of 125 kt by 0600 UTC 2 October, when the cyclone was located about 300 n mi south-southwest of Port-au-Prince, Haiti. It is worth noting that during Matthew 's post-peak-intensity weakening phase, the innermost RMW remained fairly steady at about 5-7 n mi for more than 48 h ( ). Maintenance of the small RMW may have contributed to the re-intensification phase that the Hurricane underwent between 0600 UTC and 1800 UTC on 2 October when Matthew was moving northward around the western periphery of a broad deep-layer ridge located over the central subtropical Atlantic.