Example: biology
Hypothesis Testing for Proportions
Hypothesis Testing for Proportions 2 HT - 7 Statistical Hypothesis Alternative hypothesis (H 1 or Ha) Usually corresponds to research hypothesis and opposite to null hypothesis, often has >, < or ≠notation in testing mean. Example: Ha: p ≠30% or Ha: Percentage of votes for A is not 30%. HT - 8 Hypotheses Statements Example
Tags:
Information
Domain:
Source:
Link to this page:
Documents from same domain
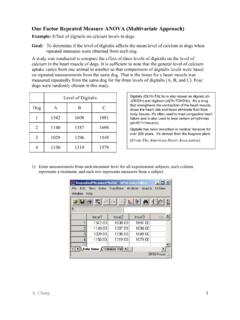
One Factor Repeated Measure ANOVA …
gchang.people.ysu.eduA. Chang 2 2) Click through the following sequence of options to perform repeated measures analysis. Analyze / General Linear Model / Repeated Measures …

One Sample t-Test - Dr. Guang-Hwa Andy Chang
gchang.people.ysu.edu1 One Sample t-Test Purpose: One sample t-test is a statistical procedure often performed for testing the mean value of a distribution. It can be used under the assumption that sampled distribution is normal. For large samples, the procedure often performs well even for non-normal populations.

Box Plot and Side-by-Side Box Plot
gchang.people.ysu.edu4.) View Plot. For side by side Box Plots step 1 is repeated. 2.) Enter Data in a column with 1 or 2 in the column next to it denoting month 1 and

Wilcoxon Signed Rank Test Purpose t
gchang.people.ysu.eduSPSS Note on Signed Rank Test Interpret SPSS Output: The statistics for the test are in the following table. For Two-sided test: The two-sided test p-value for Asymptotic 2-tailed test is .002 and for the Exact 2- tailed is 0.001. For one-sided test: The first table below shows that the negative mean rank is less than the positive mean rank. This suggests that the pulse rate measure from after ...

Logistic Regression and Odds Ratio
gchang.people.ysu.eduLogistic Regression and Odds Ratio A. Chang 1 Odds Ratio Review Let p1 be the probability of success in row 1 (probability of Brain Tumor in row 1) 1 − p1 is the probability of not success in row 1 (probability of no Brain Tumor in row 1) Odd of getting disease for the people who were exposed to the risk factor: ( pˆ1 is an estimate of p1) O+ = Let p0 be the probability of success …

How to Use SPSS for Contingency Table, Relative Risk, Odds ...
gchang.people.ysu.eduContingency Table and Chi-square Test 1 How to Use SPSS for Contingency Table, Relative Risk, Odds Ratio and Chi-Square Test Example: Suppose we conducted a prospective cohort study to investigate the effect of aspirin on heart disease. A group of patients who are at risk for a heart attack are randomly assigned to either a placebo or aspirin.
Related documents
Introduction to Hypothesis Testing - SAGE Publications Inc
www.sagepub.comAn alternative hypothesis (H 1) is a statement that directly contradicts a null hypothesis by stating that that the actual value of a population parameter is less than, greater than, or not equal to the value stated in the null hypothesis. The alternative hypothesis states what we think is wrong about the null hypothesis, which is needed for ...

Null hypothesis vs. alternative hypothesis
courses.cit.cornell.eduEcon 620 Null hypothesis vs. alternative hypothesis Suppose that we have data y =(y1,···,yn) and the data is generated by the true probability distribution Pθ0, from a family of probability distribution Pθ indexed by θ ∈ Θ. We can partition the parameter space Θ into two subsets, Θ0 and ΘA. Now, consider the following two hypothesis;
DEVELOPING HYPOTHESIS AND RESEARCH QUESTIONS
www.public.asu.eduThe null hypothesis represents a theory that has been put forward, either because it is believed to be true or because it is to be used as a basis for argument, but has not been proved. Has serious outcome if incorrect decision is made! The alternative hypothesisis a statement of what a hypothesis test is set up to establish.
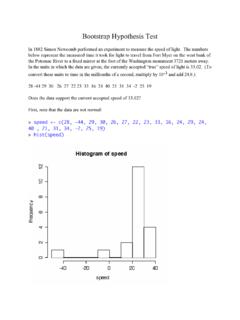
Bootstrap Hypothesis Test - University of California, Los ...
www.stat.ucla.edu> t.test(betterspeed,alternative="two.sided",mu=33.02) One Sample t-test data: betterspeed t = -4.6078, df = 17, p-value = 0.0002508 alternative hypothesis: true mean is not equal to 33.02 95 percent confidence interval: 23.83863 29.60582 sample estimates: mean of x 26.72222 As you can see, the p-value is not exactly 0, but is quite small.

Statistical Hypothesis Testing
www.afit.eduThe alternative hypothesis is the claim to be tested; it reflects what the tester is trying to show. To illustrate the concept of null and alternative hypotheses, consider a criminal trial. In the criminal justice system, the defendant is presumed innocent until …
Hypothesis Testing - Duke University
www2.stat.duke.edu23.1 How Hypothesis Tests Are Reported in the News 1. Determine the null hypothesis and the alternative hypothesis. 2. Collect and summarize the data into a test statistic. 3. Use the test statistic to determine the p-value. 4. The result is statistically significant if the p-value is less than or equal to the level of significance.

Chapter 6 Hypothesis Testing - University of Pittsburgh
sites.pitt.eduAn Alternative Decision Rule using the p - value Definition The p-value is defined as the smallest value of α for which the null hypothesis can be rejected. If the p-value is less than or equal to α ,we reject the null hypothesis (p ≤ α) If the p-value is greater than α ,we do not reject the null hypothesis (p > α)