Transcription of Introduction to Hypothesis Testing - SAGE Publications Inc
1 CHAPTER8 Introduction to Hypothesis TestingLEARNING OBJECTIVESA fter reading this chapter, you should be able to:1 Identify the four steps of Hypothesis Define null Hypothesis , alternative Hypothesis , level of significance, test statistic, p value, and statistical Define Type I error and Type II error, and identify the type of error that researchers Calculate the one-independent sample z test and interpret the Distinguish between a one-tailed and two-tailed test, and explain why a Type III error is possible only with one-tailed Explain what effect size measures and compute a Cohen s d for the one-independent sample z Define power and identify six factors that influence Summarize the results of a one-independent sample z test in American Psychological Association (APA)
2 Inferential Statistics and Hypothesis Four Steps to Hypothesis Hypothesis Testing and Sampling Making a Decision: Types of Testing a Research Hypothesis : Examples Using the z Te s Research in Focus: Directional Versus Nondirectional Measuring the Size of an Effect: Cohen s Effect Size, Power, and Sample Additional Factors That Increase SPSS in Focus: A Preview for Chapters 9 to APA in Focus: Reporting the Test Statistic and Effect Size2 PART III: PROBABILITY AND THE FOUNDATIONS OF INFERENTIAL INFERENTIAL STATISTICS AND Hypothesis TESTINGWe use inferential statistics because it allows us to measure behavior in samples to learn more about the behavior in populations that are often too large or inaccessi ble.
3 We use samples because we know how they are related to populations. For example, suppose the average score on a standardized exam in a given population is 1,000. In Chapter 7, we showed that the sample mean as an unbiased estimator of the population mean if we selected a random sample from a population, then on average the value of the sample mean will equal the population mean. In our exam ple, if we select a random sample from this population with a mean of 1,000, then on average, the value of a sample mean will equal 1,000. On the basis of the central limit theorem, we know that the probability of selecting any other sample mean value from this population is normally behavioral research, we select samples to learn more about populations of interest to us.
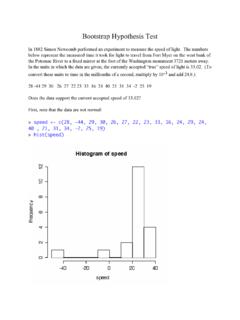
4 In terms of the mean, we measure a sample mean to learn more about the mean in a population. Therefore, we will use the sample mean to describe the population mean. We begin by stating the value of a population mean, and then we select a sample and measure the mean in that sample. On average, the value of the sample mean will equal the population mean. The larger the difference or discrep ancy between the sample mean and population mean, the less likely it is that we could have selected that sample mean, if the value of the population mean is cor rect. This type of experimental situation, using the example of standardized exam scores, is illustrated in Figure = 1000We expect the sample mean to be equal to the population mean.
5 FIGURE sampling distribution for a population mean is equal to 1,000. If 1,000 is the correct population mean, then we know that, on average, the sample mean will equal 1,000 (the population mean). Using the empirical rule, we know that about 95% of all samples selected from this population will have a sample mean that falls within two standard deviations (SD) of the mean. It is therefore unlikely (less than a 5% probability) that we will measure a sample mean beyond 2 SD from the population mean, if the population mean is indeed method in which we select samples to learn more about characteristics in a given population is called Hypothesis Testing . Hypothesis Testing is really a systematic way to test claims or ideas about a group or population.
6 To illustrate, CHAPTER 8: Introduction TO Hypothesis Testing 3suppose we read an article stating that children in the United States watch an aver age of 3 hours of TV per week. To test whether this claim is true, we record the time (in hours) that a group of 20 American children (the sample), among all children in the United States (the population), watch TV. The mean we measure for these 20 children is a sample mean. We can then compare the sample mean we select to the population mean stated in the Testing or significance Testing is a method for Testing a claim or Hypothesis about a parameter in a population, using data measured in a sample. In this method, we test some Hypothesis by determining the likelihood that a sample statistic could have been selected, if the Hypothesis regarding the population parameter were method of Hypothesis Testing can be summarized in four steps.
7 We will describe each of these four steps in greater detail in Section 1. To begin, we identify a Hypothesis or claim that we feel should be tested. For example, we might want to test the claim that the mean number of hours that children in the United States watch TV is 3 hours. 2. We select a criterion upon which we decide that the claim being tested is true or not. For example, the claim is that children watch 3 hours of TV per week. Most samples we select should have a mean close to or equal to 3 hours if the claim we are Testing is true. So at what point do we decide that the discrepancy between the sample mean and 3 is so big that the claim we are Testing is likely not true? We answer this question in this step of Hypothesis Testing .
8 3. Select a random sample from the population and measure the sample mean. For example, we could select 20 children and measure the mean time (in hours) that they watch TV per week. 4. Compare what we observe in the sample to what we expect to observe if the claim we are Testing is true. We expect the sample mean to be around 3 hours. If the discrepancy between the sample mean and population mean is small, then we will likely decide that the claim we are Testing is indeed true. If the discrepancy is too large, then we will likely decide to reject the claim as being not On average, what do we expect the sample mean to be equal to?2. True or false: Researchers select a sample from a population to learn more about characteristics in that : Hypothesis Testing is the method of Testing whether claims or hypotheses regarding a population are likely to be CHECK 1 Answers: 1.
9 The population mean; 2. False. Researchers select a sample from a population to learn more about characteristics in the population that the sample was selected PART III: PROBABILITY AND THE FOUNDATIONS OF INFERENTIAL FOUR STEPS TO Hypothesis TESTINGThe goal of Hypothesis Testing is to determine the likelihood that a population parameter, such as the mean, is likely to be true. In this section, we describe the four steps of Hypothesis Testing that were briefly introduced in Section : Step 1: State the hypotheses. Step 2: Set the criteria for a decision. Step 3: Compute the test statistic. Step 4: Make a 1: State the hypotheses. We begin by stating the value of a population mean in a null Hypothesis , which we presume is true.
10 For the children watching TV example, we state the null Hypothesis that children in the United States watch an average of 3 hours of TV per week. This is a starting point so that we can decide whether this is likely to be true, similar to the presumption of innocence in a courtroom. When a defendant is on trial, the jury starts by assuming that the defendant is innocent. The basis of the decision is to determine whether this assumption is true. Likewise, in Hypothesis Testing , we start by assuming that the Hypothesis or claim we are Testing is true. This is stated in the null Hypothesis . The basis of the decision is to determine whether this assumption is likely to be null Hypothesis (H0), stated as the null, is a statement about a population parameter, such as the population mean, that is assumed to be null Hypothesis is a starting point.