Transcription of Industrial sector energy consumption
1 Chapter 7. Industrial sector energy consumption Overview The Industrial sector uses more delivered energy294 than any other end-use sector , consuming about 54% of the world's total delivered energy . The Industrial sector can be categorized by three distinct industry types: energy -intensive manufacturing, nonenergy-intensive manufacturing, and nonmanufacturing (Table 7-1). The mix and intensity of fuels consumed in the Industrial sector vary across regions and countries, depending on the level and mix of economic activity and on technological development. energy is used in the Industrial sector for a wide range of purposes, such as process and assembly, steam and cogeneration, process heating and cooling, and lighting, heating, and air conditioning for buildings. Industrial sector energy consumption also includes basic chemical feedstocks. Natural gas feedstocks are used to produce agricultural chemicals. Natural gas liquids (NGL) and petroleum products (such as naphtha) are both used for the manufacture of organic chemicals and plastics, among other uses.
2 In the International energy Outlook 2016 (IEO2016) Reference case, worldwide Industrial sector energy consumption is projected to increase by an average of , from 222 quadrillion British thermal units (Btu) in 2012 to 309 quadrillion Btu in 2040. (Table 7-2). Most of the long-term growth in Industrial sector delivered energy consumption occurs in countries outside of the Organization for Economic Cooperation and Development (OECD). From 2012 to 2040, Industrial energy consumption in non- OECD countries grows by an average of , compared with in OECD countries. Non-OECD Industrial energy consumption , which accounted for 67% of world Industrial sector delivered energy in 2012, accounts for 73% of world Industrial sector delivered energy consumption in 2040. Overall, total Industrial sector energy use increases from 73 quadrillion Btu in 2012 to 85 quadrillion Btu in 2040 in the OECD. countries, and from 149 quadrillion Btu in 2012 to 225 quadrillion Btu in 2040 in the non-OECD countries.
3 OECD Industrial sector energy use grows slowly in the IEO2016 Reference case, averaging from 2012 to 2040. The Industrial sector accounts for approximately 40% of total OECD delivered energy use from 2012 to 2040. In the non-OECD Industrial sector , the share of delivered energy use declines from 64% in 2012 to 59% in 2040, as many emerging non-OECD economies move away from energy -intensive manufacturing, while energy use grows more rapidly in all other end-use sectors. Table 7-1. World Industrial sector : major groupings and representative industries Industry grouping Representative industries energy -intensive manufacturing Food Food, beverage, and tobacco product manufacturing Pulp and paper Paper manufacturing, printing and related support activities Basic chemicals Inorganic chemicals, organic chemicals ( , ethylene propylene), resins, and agricultural chemicals;. includes chemical feedstocks Refining Petroleum refineries and coal products manufacturing, including coal and natural gas used as feedstocks Iron and steel Iron and steel manufacturing, including coke ovens Nonferrous metals Primarily aluminum and other nonferrous metals, such as copper, zinc, and tin Nonmetallic minerals Primarily cement and other nonmetallic minerals, such as glass, lime, gypsum, and clay products Nonenergy-intensive manufacturing Other chemicals Pharmaceuticals (medicinal and botanical), paint and coatings, adhesives, detergents, and other miscellaneous chemical products, including chemical feedstocks Other industrials All other Industrial manufacturing, including metal-based durables (fabricated metal products, machinery, computer and electronic products, transportation equipment, and electrical equipment).
4 Nonmanufacturing Agriculture, forestry, fishing Agriculture, forestry, and fishing Mining Coal mining, oil and natural gas extraction, and mining of metallic and nonmetallic minerals Construction Construction of buildings (residential and commercial), heavy and civil engineering construction, Industrial construction, and specialty trade contractors 294. Delivered energy is measured as the heat content of energy at the site of use. It includes the heat content of electricity (3,412 Btu/kWh) but does not include conversion losses at generation plants in the electricity sector . Delivered energy also includes fuels (natural gas, coal, liquids, and renewables) used for combined heat and power facilities (cogeneration) in the Industrial sector . energy Information Administration | International energy Outlook 2016 113. Industrial sector energy consumption Regional gross output and Industrial energy consumption In the IEO2016 Reference case, real inflation-adjusted gross output is used to estimate Industrial sector energy consumption by disaggregating economic activity into sectors and industries.
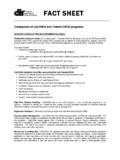
5 Gross output includes intermediate inputs such as energy , materials, and purchased services used in production processes, providing data on all industry links that make up economic activity. In contrast, gross domestic product (GDP) and its components which are value-added concepts do not include intermediate inputs to Industrial processes. In the IEO2016 projections, analysis of the key components of Industrial gross output and how they change over time helps to explain regional changes in Industrial sector energy consumption . Total gross output includes all economic activity, while Industrial Figure 7-1. Global gross output by Industrial energy use includes three subsectors: nonmanufacturing, subsector, 2012 and 2040 (trillion 2010 dollars) energy -intensive manufacturing, and nonenergy-intensive 250 manufacturing (Table 7-3).295 The shares of the gross output 228 sectors vary by region and over time. Worldwide, gross output from the services sector increases by from 2012 to 200.
6 30%. 2040 in the IEO2016 Reference case, and energy -intensive Nonmanufacturing manufacturing increases at a similar rate of In contrast, gross output from the nonmanufacturing sector 150 grows at a slower rate of The fastest growth is Non- energy -intensive projected for the nonenergy-intensive manufacturing sector , at manufacturing 43% This results in a long-term shift in the composition 100 90 of gross output in the IEO2016 Reference case (Figure 7-1), showing a general long-term trend toward a worldwide 34%. economy that is slightly less dependent on agricultural and 50 mined natural resources two of the three nonmanufacturing 39% energy -intensive 27% industries. A move away from resource-based or agriculture- manufacturing 27% based national output, which has long been observed in the 0 developed economies, is anticipated in the long-term outlook 2012 2040. for the world's emerging economies. (continued on page 115). Table 7-2. World Industrial sector delivered energy consumption by region and energy source, 2012 40.
7 (quadrillion Btu). Average annual percent energy source by region 2012 2020 2025 2030 2035 2040 change, 2012 40. OECD Liquid fuels Natural gas Coal Electricity Renewables Non-OECD Liquid fuels Natural gas Coal Electricity Renewables Total World Liquid fuels Natural gas Coal Electricity Renewables Note: Data on delivered Industrial sector energy consumption do not include conversion losses at electricity sector generation plants. Delivered energy includes fuels (natural gas, coal, liquids, and renewables) used for combined heat and power facilities (cogeneration) in the Industrial sector . 295. Details of the industries included in gross output, along with their NACE 2 codes, can be found in the IEO2016 macroeconomic documentation. 114 energy Information Administration | International energy Outlook 2016. Industrial sector energy consumption Globally, much of the slower growth in the nonmanufacturing sector is offset by increased growth in the services and nonenergy- intensive manufacturing sectors, whereas the energy -intensive manufacturing share of total gross output does not change.
8 Many manufacturing industries are driven by trade. Some countries benefit from access to supply chains for technology goods; some benefit from competitive labor costs that lead to increases in nonenergy-intensive manufacturing production. Regional growth in the nonmanufacturing and services sectors differs according to the variety of industries that make up the sectors. In some regions, growth in the services sector is based on government spending, which is not necessarily linked to technological advances or access to markets. In other regions, growth in the nonmanufacturing sector is based on the availability of natural resources. On a regional basis, the largest changes in Industrial sector composition in the IEO2016 Reference case are projected for the Middle East and Russia (where mining/extraction is the largest component of the nonmanufacturing sector ), and for India (where agriculture is currently the largest component of the nonmanufacturing sector ) as a result of development and increasing standards of living, as well as changing fuel markets.
9 In those regions, relatively rapid increases are projected for the services sector from 2012 to 2040, with all other gross output sectors, and particularly the nonmanufacturing sector , becoming smaller. For India, the shift toward services is explained by slower growth in the agriculture industry. For the Middle East and Russia, the shift is explained by slower growth in the oil and natural gas extraction industry. For Mexico and Chile, there is a notable increase in the nonenergy-intensive manufacturing sector share of their combined economies. Although the IEO2016 projections do not include explicit calculations for the individual industries that make up the other Industrial category, its largest component is transportation equipment. Growth in the transportation equipment industry is expected to account for much of the growth in both countries' nonenergy-intensive manufacturing sectors. Both China and OECD Europe have declared goals to move away from heavy industry in the future.
10 Although the IEO2016 Reference case does not show double-digit changes for its Industrial sector , China remains one of the most influential economies in the world. The services sector share of China's economy increases in the Reference case, and growth in the nonmanufacturing and energy -intensive manufacturing sectors is slower than growth in the services sector . OECD Europe, which continues to account for the third-largest share of world gross output through 2040, shows a small shift away from the most energy -intensive industries over the projection period. (continued on page 116). Table 7-3. Average annual growth in gross output by region and sector , 2012 40 (percent per year). IEO2016 Industrial sector activity energy -intensive Nonenergy-intensive Nonmanufacturing Service sector /. Region manufacturing sector manufacturing sector sector rest of economy OECD OECD Americas United States Canada Mexico/Chile OECD Europe OECD Asia Japan South Korea Australia/New Zealand Non-OECD Non-OECD Europe and Eurasia Russia Other Non-OECD Asia China India Other Middle East Africa Non-OECD Americas Brazil Other Total World energy Information Administration | International energy Outlook 2016 115.