Transcription of Top 100 U.S. Oil and Gas Fields
1 Top 100 Oil and Gas Fields March 2015 Independent Statistics & Analysis Department of Energy Washington, DC 20585 Energy Information Administration | Top 100 Oil and Gas Fields i This report was prepared by the Energy Information Administration (EIA), the statistical and analytical agency within the Department of Energy. By law, EIA s data, analyses, and forecasts are independent of approval by any other officer or employee of the United States Government. The views in this report therefore should not be construed as representing those of the Department of Energy or other Federal 2015 Energy Information Administration | Top 100 Oil and Gas Fields ii Table of Contents Top 100 Oil and Gas Fields .
2 1 Introduction .. 1 The top 100 s share of proved reserves in 2013 .. 1 Changes since 2009 .. 4 Changes in the top 100 Oil Fields .. 4 Changes in the top 100 gas Fields .. 4 Top 100 Fields ranking tables .. 4 March 2015 Energy Information Administration | Top 100 Oil and Gas Fields iii Figures Figure 1. proved reserves of crude oil and lease condensate, 1993-2013 .. 1 Figure 2. proved reserves of total natural gas, 1993-2013 .. 2 Figure 3. Distribution of proved reserves, 2013 (in groups of 10) .. 3 March 2015 Energy Information Administration | Top 100 Oil and Gas Fields iv Tables Table 1. Top 100 oil Fields as of December 31, 2013.
3 5 Table 2. Top 100 gas Fields as of December 31, 2013 .. 8 March 2015 Energy Information Administration | Top 100 Oil and Gas Fields 1 Top 100 Oil and Gas Fields Introduction This supplement to the Energy Information Administration s (EIA) Crude Oil and Natural Gas Proved Reserves, 2013 ranks the 100 largest oil and gas Fields by their estimated 2013 proved reserves. EIA defines a field as an area consisting of a single reservoir or multiple reservoirs all grouped on, or related to, the same individual geological structural feature and/or stratigraphic condition. There may be two or more reservoirs in a field that are separated vertically by intervening impervious strata or laterally by local geologic barriers, or by both.
4 This definition is not used by all states in their designation of Fields ; consequently, areas classified as individual Fields by some states may be found combined in these tables or in the EIA field Code Master List. Particularly in the case of unconventional shale plays for both crude oil and natural gas, multiple areas or Fields may have been combined into one entry within these ranking tables. The resultant field entry in the table is labeled as an area or unit, , Marcellus Shale Area, Haynesville Shale Unit, Spraberry Trend Area, and Hugoton Gas Area. The oil field production and reserves data include both crude oil and lease condensate. The gas field production and reserves data are total natural gas, wet after lease separation, which is the sum of associated-dissolved natural gas and nonassociated natural gas with natural gas plant liquids not yet removed.
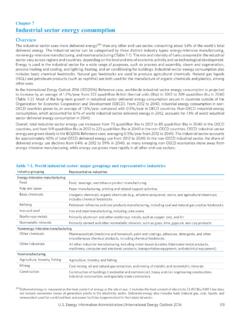
5 The top 100 s share of proved reserves in 2013 The top 100 oil Fields as of December 31, 2013, accounted for billion barrels of crude oil and lease condensate proved reserves, which was 56% of the total ( billion barrels) in 2013 (Figure 1). Figure 1. proved reserves of crude oil and lease condensate, 1993-2013 billion barrels Notes: Annual Reports in 1994-95 featured a reprint of 1993 top 100 Fields data. No top 100 Fields data were published in 2010-12. Sources: Energy Information Administration, Form EIA-23L, Annual Survey of Domestic Oil and Gas Reserves, 2013. Crude Oil, Natural Gas, and Natural Gas Liquids Proved Reserves (DOE/EIA-0216), Annual Reports 1993-2009.
6 Crude oil and lease condensate proved reservesTop 100 Fields reserves subtotalMarch 2015 Energy Information Administration | Top 100 Oil and Gas Fields 2 The top 100 gas Fields as of December 31, 2013, accounted for trillion cubic feet of total natural gas proved reserves, about 68% of the total natural gas proved reserves in 2013 (Figure 2). Figure 2. proved reserves of total natural gas, 1993-2013 trillion cubic feet Notes: Annual Reports in 1994-95 featured a reprint of 1993 top 100 Fields data. No top 100 Fields data were published in 2010-12. Sources: Energy Information Administration, Form EIA-23L, Annual Survey of Domestic Oil and Gas Reserves, 2013.
7 Crude Oil, Natural Gas, and Natural Gas Liquids Proved Reserves (DOE/EIA-0216), Annual Reports 1993-2009. total natural gas proved reservesTop 100 Fields reserves subtotalMarch 2015 Energy Information Administration | Top 100 Oil and Gas Fields 3 Figure 3. Distribution of proved reserves, 2013 (in groups of 10) percentage of proved reserves Note: In some Fields , only one or very few operators are the source of proved reserves estimates. Therefore, EIA does not provide field -specific proved reserves estimates in order to avoid compromising proprietary data. Instead, EIA combines the proved reserves estimates of the top 100 Fields into groups of 10 to provide a sense of the operated concentration of total proved reserves, while still protecting data sources.
8 Columns may not add to 100% because of independent rounding. Source: Energy Information Administration, Form EIA-23L, Annual Survey of Domestic Oil and Gas Reserves, 2013. March 2015 Energy Information Administration | Top 100 Oil and Gas Fields 4 Changes Since 2009 EIA last published its ranking of the top 100 oil and gas Fields in 2009. Changes in the top 100 Oil Fields In 2009, the United States had billion barrels of crude oil and lease condensate proved reserves, and its top 100 oil Fields had of that total, or billion barrels of proved reserves. In 2013, the United States had billion barrels of crude oil and lease condensate proved reserves, and its top 100 oil Fields had of that total, or billion barrels of proved reserves (Table 1).
9 Prominent new additions to the top 10 are two Fields from the Eagle Ford Shale Play in Texas, Eagleville and Briscoe Ranch. Eagleville, discovered in 2009, spans 14 counties in South Texas and is the country s largest oil field as ranked by estimated proved reserves. Prudhoe Bay field in Alaska (the largest oil field in 2009) declined in rank to third place, also behind the Spraberry Trend Area of Texas. Changes in the top 100 gas Fields In 2009, the United States had trillion cubic feet (Tcf) of total natural gas proved reserves, and its top 100 gas Fields had of that total, or Tcf of proved reserves. In 2013, the United States had Tcf of total natural gas proved reserves, and its top 100 gas Fields had of the total, or billion cubic feet of proved reserves (Table 2).
10 A notable addition to the top 10 is the Marcellus Shale Area. This shale gas play currently includes proved reserves from north central West Virginia and a large expanse of Pennsylvania from the southwest corner to the northeast. The Marcellus Shale Area has surpassed the Barnett Shale to become the largest gas field ranked by estimated proved reserves in 2013. Top 100 Fields ranking tables The following tables rank the top 100 oil and gas Fields by their 2013 proved reserves, but the field -specific reserves are not disclosed. Instead, field -specific estimated production volumes (provided by operators) are offered to give an idea of relative field size. Also included in the tables are the discovery years of the top 100 Fields (Source: Energy Information Administration, 2013 field Code Master List.)