Transcription of INSTRUMENTAL ANALYSIS (I)
1 INSTRUMENTAL ANALYSIS (I) INTRODUCTION Classification of Analytical Methods Qualitative INSTRUMENTAL ANALYSIS is that measured property indicates presence of analyte in matrix Quantitative INSTRUMENTAL ANALYSIS is that magnitude of measured property is proportional to concentration of analyte in matrix Species of interest: All constituents including analyte and Matrix-analyte (concomitants) Often need pretreatment - chemical extraction, distillation, separation, precipitation (A) Classical: Qualitative - identification by color, indicators, boiling points, odors Quantitative - mass or volume ( gravimetric, volumetric) (B) INSTRUMENTAL : Qualitative - chromatography, electrophoresis and identification by measuring physical property ( spectroscopy, electrode potential) Quantitative - measuring property and determining relationship to concentration ( spectrophotometry , mass spectrometry) Often, same INSTRUMENTAL method used for qualitative and quantitative ANALYSIS Types of INSTRUMENTAL Methods Property Example MethodRadiation emission Emission spectroscopy - fluorescence, phosphorescence, luminescence Radiation absorption Absorption spectroscopy - spectrophotometry , photometry, nuclear magnetic resonance, electron spin resonance Radiation scattering Turbidity, Raman Radiation refraction Refractometry, interferometry Radiation diffraction X-ray, electron Radiation rotation Polarimetry, circular dichroism Electrical potential Potentiometry Electrical charge Coulometry Electrical current Voltammetry - amperometry, polarography Electrical resistance Conductometry Mass Gravimetry Mass-to-charge ratio Mass spectrometry Thermal Thermal gravimetry, calorimetry Rate of reaction Stopped flow.
2 Flow injection ANALYSIS Radioactivity Activation, isotope dilution (Often combined with chromatographic or electrophoretic methods) Example: spectrophotometry Instrument: spectrophotometer Stimulus: monochromatic light energy Analytical response: light absorption Transducer: photocell Data: electrical current Data processor: current meter Readout: meter scale Data Domains: way of encoding analytical response in electrical or non-electrical signals. Interdomain conversions transform information from one domain to another. Detector (general): device that indicates change in environment Transducer (specific): device that converts non-electrical to electrical data Sensor (specific): device that converts chemical to electrical data Non-Electrical Domains Electrical Domains Physical (light intensity, color) Chemical (pH) Scale Position (length) Number (objects) Current Voltage Charge Frequency Pulse width Phase Count Serial Parallel Time - vary with time (frequency, phase, pulse width) Analog - continuously variable magnitude (current, voltage, charge) Digital - discrete values (count, serial, parallel, number*) Digital Binary Data Advantages (1) easy to store (2) not susceptible to noise How to choose an analytical method?
3 How good is measurement? How reproducible? - Precision How close to true value? - Accuracy/Bias How small a difference can be measured? - Sensitivity What range of amounts? - Dynamic Range How much interference? - Selectivity Precision - Indeterminate or random errors Accuracy - Determinate errors (operator, method, INSTRUMENTAL ) Sensitivity (larger slope of calibration curve m, more sensitive measurement) Detection Limit Signal must be bigger than random noise of blank From statistics k=3 or more (at 95% confidence level) Dynamic Range At detection limit we can say confidently analyte is present but cannot perform reliable quantitation Level of quantitation (LOQ): k=10 Limit of linearity (LOL): when signal is no longer proportional to concentration Selectivity: No analytical method is completely free from interference by concomitants. Best method is more sensitive to analyte than interfering species (interferent).
4 K's vary between 0 (no selectivity) and large number (very selective). Calibration methods Basis of quantitative ANALYSIS is magnitude of measured property is proportional to concentration of analyte Calibration curves (working or analytical curves) Calibration expression is Absorbance = slope [Analyte (ppm)] + intercept SPECTROCHEMICAL TECHNIQUES INTRODUCTION Methods of ANALYSIS based on the interaction of LIGHT with matter. LIGHT is an Electromagnetic (EM) radiation: Speed of light, c = x 108 m / s .Frequency is always fixed but velocity can vary! H = Planck's Constant = J s 3. Atoms, ions and molecules exist in certain energy states only E0 = ground state E1, E2 , E3 .. = excited states Excitation can be electronic, vibrational or rotational Energy levels for atoms, ions or molecules different. 2. When an atom, ion or molecule changes energy state, it absorbs or emits energy equal to the energy difference E = E1 E0 3.
5 The wavelength or frequency of radiation absorbed or emitted during a transition is proportional to E EMISSION SPECTRA Have you noticed the bright yellow light emitted when crystals of NaCl fall in the flame in your cooker at home? This is emission Plot of emission intensity vs. or called emission spectrum Atom: line emission spectra Inner shell (core) electrons (1s 2p) x-rays photons Outer shell (valence) electrons (3d 4p) UV/vis photons Molecule: vibrational and rotational transitions - band emission spectra Continuum Spectra: A piece of iron in the fire: first become red then white, Why? Very broad band spectra in Emission from solids produced by blackbody radiation thermal excitation and relaxation of many vibrational (and rotational) levels. Blackbody Spectrum Absorption Spectra Plot of Absorbance vs. or called absorption spectrum just as in emission spectra an atom, ion or molecule can only absorb radiation if energy matches separation between two energy states Atoms: No vibrational or rotational energy levels - sharp line spectra with few features For example: Na 3s 3p , nm (yellow) Na 3s 5p , nm (UV) visible enough energy for valence (bonding) excitations UV and x-ray enough energy for core (inner) excitations Molecules.
6 Electronic, vibrational and rotational energy levels - broad band spectra with many features E = Eelectronic + Evibrational + Erotational For each electronic state - many vibrational states For each vibrational state - many rotational states many features Absorption spectra affected by (1) number of atoms in molecule more features (2) solvent molecules blurred features Effect of Chemical State Emission produces emission at same wavelength as absorption (common for atoms) Excitation methods: EM radiation SPECTROSCOPY AND INSTRUMENTATION (IR, visible and UV) Examples: T= (100 %T), A= T= (10 %T), A= T= ( %T), A= Determination of concentration from Absorbance measurements; Absorbance is directly proportional to the concentration, c, and the path length, b, of the absorbing species; BEER-LAMBERT'S LAW: A c and A b so A b c A = a b c proportionality constant, a = absorptivity - units (L/g cm) If units of concentration are M (mol/L) then use molar absorptivity Absorbance is additive in a mixture of 2 components So what is the Beer Lambert law used to calculate?
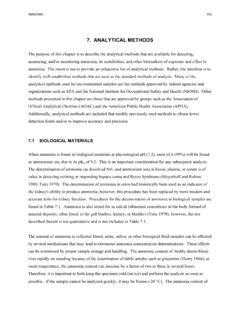
7 The molar absorption coefficient, and max which is the wavelength at which maximum absorption occurs. PHOTOMETRIC ERROR At low absorbance values, I (incident) I (transmitted) Thus, error is relatively large. At high absorbance values, I (transmitted) too small not measured accurately. Relative error in A vs %T of KMnO4 solutions at 523 nm where = 2400. Lowest error needs %T = 38,6% = A value A. Working is possible within -/+ 15% which is absorbance as best measurement range. INSTRUMENTS: (1) Radiation Sources: Tungsten Lamp == visible ; Deuterium lamp == UV; Globar Silicon Carbide == IR. (2) Sample Containers and Optics: Cuvettes Made of Glass 400-3000 nm (vis-near IR) Silica/quartz 200-3000 nm (UV-near IR) NaCl 200-15,000 nm (UV-far IR) (3) wavelength selector Filters: Absorption filter - colored glass or dye between two glass plates; Interference filter two thin sheets of metal sandwiched between glass plates, separated by transparent material.
8 Interference for transmitted wave through 1st layer and reflected from 2nd layer Monochromators: consists of Entrance slit, Collimating lens or mirror; Dispersion element (prism or grating), Focusing lens or mirror and Exit slit Typical Prism Monochromator (4) radiation detector (A) Photovoltaic cells (B) Phototube: radiation falls on a sensitive Plate which produces electron. (C) Photomultiplier tube (PMT) (D) Thermal detectors sensitive to IR ( >750 nm) (5) Signal processor and readout Double Beam systems: a. Light from the source is segmented by a rotating segmented mirror which allows radiation through to the sample and reflects it through the reference cell alternately. b. The two beams are recombined by a rotating mirror in phase with the first rotating mirror. c. The combined beam is allowed to fall on the detector in which the reference signal is electronically subtracted from the sample signal before it is sent to the recording system.
9 Wavelengths of colors of visible light Applications of UV-Vis Spectrometry: UV/VIS IS USED FOR QUALITATIVE AND QUANTITATIVE DETERMINATIONS Organic molecules (bonding) molecular orbital as in n (non-bonding) atomic orbital as in Absorption of UV light energy cause transition of (bonding electrons) and n (non-bonding) to * (Antibonding) molecular orbital Inorganic Ions Most transition metal ions are colored (absorb in UV-vis) due to d d electronic transitions. Inorganic ions can be quantitatively determined by spectrophotometry by reaction with some ligands to produce colored complexes which have clear absorption in the visible region. Remember: Solution absorbs red appears blue-green Solution absorbs blue-green appears red Ligand Field Strengths: Chromium can give different colors and hence absorb at different wavelengths when reacts with different ligands. Vis UV I-<Br-<Cl-<F-<OH-<C2O42-~H2O<SCN-<NH3<en <NO2-<CN "Spectrochemical Series" Chemical kinetics of a chemical reaction, Reactant or product absorbs radiation at different wavelength.
10 Measuring A with time. Follow the formation of the product or the removal of the reactant from solution. Absorption of light by biological molecules: Chlorophyll a solutions absorb blue and red light and are green in color. DNA solutions absorb light in the ultraviolet and are colorless. Oxyhemoglobin solutions absorb blue light and are red in color. Solvent Effects: Solvent effects mean UV-Vis not reliable for qualitative but excellent for quantitative ANALYSIS . For good ANALYSIS the sample must have these properties: 1. Stability in solution; 2. Adherence to Beer's law, 3. Large molar absorptivities, 4. Sufficient separation of the desired analyte absorbance wavelength from interfering substances. If Not, the substance is usually converted into a new species suitable for quantitative spectrophotometry . SAMPLE + CHROMOGENIC REAGENT UV-VIS ABSORBING PRODUCT Example: In the determination of iron we convert it into iron(III)-thiocyanate complex, distinguished red color.