Transcription of International Energy Outlook 2019
1 September 24, #IEO2019 International Energy Outlook 2019with projections to Energy Information # Energy Information AdministrationInternational Energy Outlook 2019with projections to 2050 September Energy Information AdministrationOffice of Energy Department of EnergyWashington, DC 20585 This publication is on the Web at: report was prepared by the Energy Information Administration (EIA), the statistical and analytical agency within the Department of Energy . By law, EIA's data, analyses, and forecasts are independent of approval by any other officer or employee of the United States Government. The views in this report therefore should not be construed as representing those of the Department of Energy or other federal Energy Information # Energy Information AdministrationInternational Energy Outlook 2019 is dedicated to the memory of Linda led or contributed to the development of the International Energy Outlook for more than three Energy Information # Energy Information Administration4 Preamble5 Consumption16 Industrial32 Buildings48 Transportation64 Electricity84 Coal104 Petroleum and other liquids114 Natural gas130 Energy -related carbon dioxide146 References160 Table of Energy Information # Energy Information Energy Information # Energy Information Energy Information # Energy Information Administration The Energy
2 Information Administration s (EIA) International Energy Outlook (IEO) presents an analysis of long-term world Energy markets in sixteen regions through 2050. Reference case projections in each edition of the IEO are not predictions of what is most likely to happen, but rather they are modeled projections under various alternative assumptions. The IEO projections are published under the Department of Energy Organization Act of 1977, which requires that EIA analyze International aspects, economic and otherwise, of the evolving Energy situation and long-term relationships between Energy supply and consumption in the United States and world communities. EIA develops the IEO using the World Energy Projection System Plus (WEPS+), an integrated economic model that captures long-term relationships among Energy supply, demand, and prices across regional markets under various assumptions.
3 Energy market projections are uncertain because the events that shape future developments in technology, demographic changes, economic trends, and resource availability that drive Energy use are International Energy Outlook 2019provides long-term world Energy Energy Information # Energy Information Administration The Reference case reflects current trends and relationships among supply, demand, and prices in the future. It is a reasonable baseline case to compare with cases that include alternative assumptions about economic drivers, policy changes, or other determinants of the Energy system to estimate the potential impact of these assumptions. The Reference case includes some anticipated changes over time: Expected regional economic and demographic trends, based on the views of leading forecasters Planned changes to infrastructure, both new construction and announced retirements Assumed incremental cost and performance improvements in known technologies based on historical trends This case does not include some of the potential future changes.
4 Changes to national boundaries and International agreements Major disruptive geopolitical or economic events Future technological breakthroughs Changes to current policies as reflected in laws, regulations, and stated targets that indicate future activityThe Reference case provides a baseline to measure the impact of alternative Energy Information # Energy Information Administration To see the impact of economic growth on Energy consumption, EIA adjusted the assumptions about regional factors of growth in the High and Low Economic Growth cases. The resulting compound annual growth rates of global gross domestic product (GDP) during the projection period (2018 2050) vary from the Reference case as follows: per year, High Economic Growth case per year, Reference case per year, Low Economic Growth case The High and Low Oil Price cases address the uncertainty associated with world Energy prices.
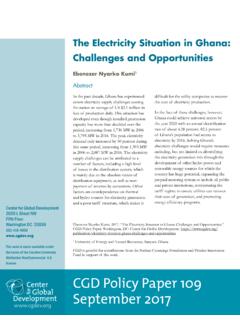
5 EIA altered the assumptions about both oil supply and demand to achieve higher and lower oil prices, as seen in the 2050 price of North Sea Brent crude oil in 2018 dollars: $185/barrel, High Oil Price case $100/barrel, Reference case $45/barrel, Low Oil Price caseSide cases address two significant sources of Energy Information # Energy Information Administration02550751001251501752002010 2020203020402050 Future oil prices are a key source of uncertainty in the projections 11 World oil prices in three casesreal 2018 dollars per barrelWorld Energy consumption in three casesquadrillion British thermal units01002003004005006007008002010202020 3020402050 HighOil PriceReferenceLowOil PriceHighOil PriceReferenceLowOil PriceOECDnon-OECD historyprojectionsLow Oil Price caseReference caseHigh Oil Price Energy Information # Energy Information Administration In addition to the Reference case.
6 EIA includes a Low Oil Price case and a High Oil Price case that use different assumptions about future oil prices, based on different views of supply and demand for liquid fuels. In the Low Oil Price case, lower economic activity, especially in countries that are not a part of the Organization of Economic Cooperation and Development (OECD), discourages Energy consumption. Simultaneously but independently, greater resource availability and lower extraction costs encourage additional petroleum supplies, despite the reduced economic growth. The resulting lower oil prices encourage liquid fuels consumption and discourage Energy conservation and fuel switching. In the High Oil Price case, Energy demand increases because non-OECD economies grow more quickly than in the Reference case, despite tighter petroleum supply conditions.
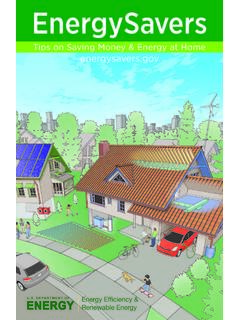
7 Although Energy consumption rises, higher oil prices limit the growth in liquid fuels, and consumers conserve or switch to alternative fuels whenever possible. with greater Energy consumption differences in non-OECD Energy Information # Energy Information Administration13 Oil prices vary widely across the High Oil Price, Reference, and Low Oil Price cases 130204060801001201402050 Low Oil Price case0204060801001201402050 High Oil Price caseOPEC crude and lease condensatenon-OPEC crude and lease condensateNGPL and other liquid fuels0204060801001201402018 2050 Referencecase010203040506070809020102020 203020402050 HighOil PriceReferenceLowOil PriceHighOil PriceReferenceLowOil PriceOECDnon-OECD historyprojectionsWorld petroleum and other liquid fuels consumptionmillion barrels per dayWorld petroleum and other liquid fuels productionmillion barrels per Energy Information # Energy Information Administration14 In the Reference case, world production of crude oil and lease condensate increases from about 80 million barrels per day (b/d) in 2018 to about 100 million b/d in 2050.
8 Total liquids production increases from 101 million b/d in 2018 to million b/d in 2050. Liquid fuels consumption increases 45% in non-OECD countries and falls 4% in OECD countries. In the High Oil Price case, world liquid fuels consumption in 2050 is 4 million b/d higher than in the Reference case. Primarily, emerging, non-OECD nations drive faster economic growth, which contributes to higher Energy demand. In the High Oil Price case, proportionally higher amounts of crude oil are supplied by countries that are not part of the Organization of the Petroleum Exporting Countries (OPEC). In the Low Oil Price case, world liquids consumption in 2050 is 1 million b/d higher than in the Reference case. Slower non-OECD economic growth assumptions lead to lower Energy demand, but the lower prices mean that consumers use more liquid fuels.
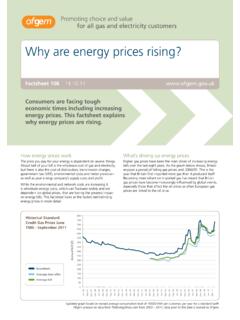
9 Low-cost producers located in OPEC countries supply more crude oil and condensate to the global marketplace. affecting where crude oil and condensate is produced Energy Information # Energy Information AdministrationEnergy consumption varies considerably across the High and Low Economic Growth cases 150501001502002503002010 2020 2030 2040 2050 HighEconomicGrowthReferenceLowEconomicGr owthHighEconomicGrowthReferenceLowEconom icGrowthOECDnon-OECDG ross domestic product trillion 2010 dollarshistoryprojections010020030040050 06007008002010 2020 2030 2040 2050 HighEconomicGrowthReferenceLowEconomicGr owthHighEconomicGrowthReferenceLowEconom icGrowthOECDnon-OECDE nergy consumptionquadrillion British thermal Energy Information # Energy Information Administration From 2018 to 2050.
10 World real GDP increases by per year in the Reference case, in the High Economic Growth case, and per year in the Low Economic growth case. In OECD countries, over the same time period, real GDP increases by per year in the Reference case, per year in the High Economic Growth case, and per year in the Low Economic growth case. In non-OECD countries, during the same time period, growth is per year in the Reference case, in the High Economic Growth case, and in the Low Economic Growth case. In the Reference case, world Energy consumption totals 911 quadrillion British thermal units (Btu) in 2050 287 quadrillion Btu in the OECD countries and 624 quadrillion Btu in the non-OECD countries. In the High Economic Growth case, world Energy use in 2050 is about 1,090 quadrillion Btu.