Transcription of Interpreting Nanodrop (Spectrophotometric) Results
1 Interpreting Nanodrop ( spectrophotometric ) Results Foundation of Spectrophotometry: The Beer Lambert Law what does it mean? A = cl Where A=absorbance, =extinction coefficient, c=concentration and l=path length. The Beer Lambert law draws a direct correlation between absorbance and concentration. While nucleic acids absorb at many wavelengths, they have a peak absorbance of UV light at 260nm. Thus, the amount of light absorbed in this region can be used to determine the concentration of RNA or DNA in solution by applying the Beer Lambert law. However, the Beer Lambert equation is only linear for absorbances between and This translates to concentrations between ng/uL and 3700 ng/uL when using the Nanodrop ND 1000. Samples outside of this range should be dried down or diluted to produce more accurate spectrophotometry Results . Absorbance at 260 nm Nucleic acids absorb UV light at 260 nm due to the aromatic base moieties within their structure.
2 Purines (thymine, cytosine and uracil) and pyrimidines (adenine and guanine) both have peak absorbances at 260 nm, thus making it the standard for quantitating nucleic acid samples. Absorbance at 280 nm The 280 nm absorbance is measured because this is typically where proteins and phenolic compounds have a strong absorbance. Aromatic amino acid side chains (tryptophan, phenylalanine, tyrosine and histidine) within proteins are responsible for this absorbance. Similarly, the aromaticity of phenol groups of organic compounds absorbs strongly near 280 nm. Absorbance at 230 nm Many organic compounds have strong absorbances at around 225 nm. In addition to phenol, TRIzol, and chaotropic salts, the peptide bonds in proteins absorb light between 200 and 230 nm. A260/280 ratio The A260/280 ratio is generally used to determine protein contamination of a nucleic acid sample. The aromatic proteins have a strong UV absorbance at 280 nm.
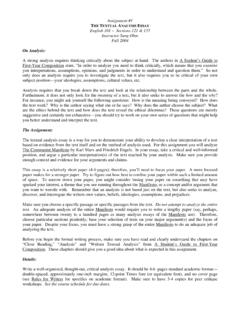
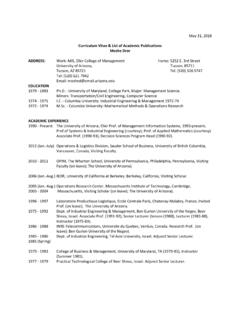
3 For pure RNA and DNA, A260/280 ratios should be somewhere around and , respectively. A lower ratio indicates the sample is protein contaminated. The presence of protein contamination may have an effect on downstream applications that use the nucleic acid samples. A260/230 ratio The A260/230 ratio indicates the presence of organic contaminants, such as (but not limited to): phenol, TRIzol, chaotropic salts and other aromatic compounds. Samples with 260/230 ratios below are considered to have a significant amount of these contaminants that will interfere with downstream applications. This is especially true for reverse transcription. In a pure sample, the A260/230 should be close to Real World Examples: The absorbance spectrum of the RNA sample below indicates a high purity with close to ideal A260/280 and A260/230 ratios. Also note that the concentration is within the reliable range of the Nanodrop ND 1000.
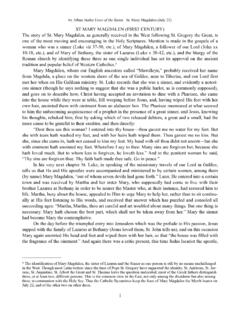
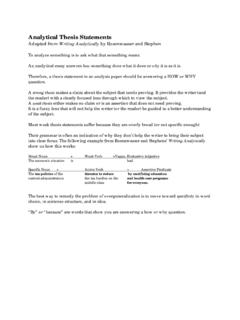
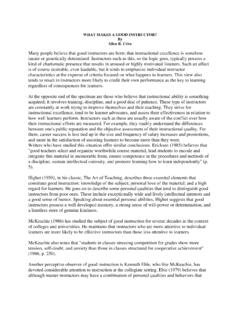
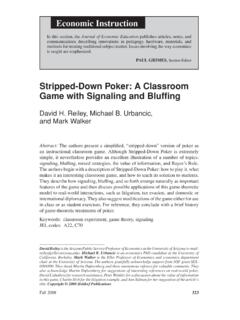
4 Interpretation: this sample is suitable for downstream applications. The RNA sample below has a good A260/280 ratio, indicating no presence of protein contaminants, however, the A260/230 ratio of is significantly lower than 2 indicating some sort of organic contaminants present in the sample. Note how there is a high shoulder at 220 nm (compare to the pure sample above) and there s a bulge on the peak shoulder at 270 nm, also indicative of contamination. Typically, the contamination is with reagents used in the isolation prodecure: TRIzol, phenol, or chaotropic salt (guanidinium isothiocyanate, aka GITC). Interpretation: this sample should be re purified on a column (or some other method). The RNA sample below has low A260/280 and A260/230 ratios. Additionally, the maximum peak is at 270 nm. This curve is typical of a high concentration of phenol (or GITC) in the sample as a result of TRIzol RNA isolation protocols with poor removal of phenol during the organic phase separations.
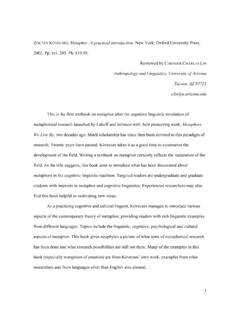
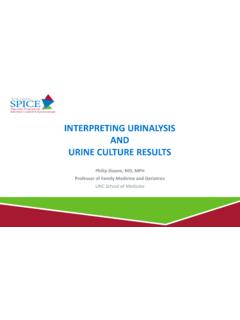
5 Note again, the high shoulder of the curve at 220 nm and that the actual nucleic acid peak at 260 nm appears as a small shoulder in the much larger phenol peak at 270nm. Intepretation: due to the low purity , this sample should be re isolated on a column (ie Qiagen RNeasy kit). Note that the concentration of RNA returned by the spectrophotometer is not at all reliable due to the contamination. This is the RNA absorbance, at 220 and 270 by contamination Below is an RNA sample with a very low concentration. Because of the low concentration, it is difficult to assess the purity of the sample by analyzing the A260/280 and A260/230 ratios. This sample may actually be good, but it cannot be assessed by the Nanodrop because it is outside the lowest concentration the Nanodrop is designed to measure. A more sensitive method such as an Agilent Biolanalyzer or Qubit analysis is recommended.
6 Interpretation: Use a more sensitive method to measure the RNA concentration Finally, keep in mind that nucleic acids absorb at 260. Just because you have absorbance at 260 nm does not mean that your RNA is intact, it could be completely degraded, or it could actually be DNA (always do the optional on column DNAse treatment).