Transcription of Introduction to Digital Signal Processing - …
1 Tech Note TN-517 Micro-MeasureMeNTsIntroduction to Digital Signal ProcessingTech NoTeStrain Gages and InstrumentsFor technical support, contact Number: 11067revision: IntroductionWhen a Signal varies with time, we are usually concerned not only with its magnitude but also with how it changes. Oscilloscopes, strip chart recorders and other analog recording devices enable us to make observations of the Signal by continuously recording and displaying the measurement data in the time domain. When Digital computers are utilized for this purpose, however, the magnitude of the Signal is sampled only at fixed intervals of time with a complete loss of continuity between.
2 For data acquired in this form, the mathematics of Digital Signal Processing can be used to analyze the Signal in both the time and frequency domains. That is, we can know not only how the magnitude of the Signal varied with time, but also what the amplitudes of any oscillations were over a spectrum of Tech Note is intended as a guide to understanding the necessary considerations for converting an analog Signal into a useful series of discrete Digital data, particularly as related to StrainSmart Data Systems. Signal FundamentalsCare must be taken when dealing with Digital data to avoid the creation of false, lower-frequency signals by a phenomenon called aliasing.
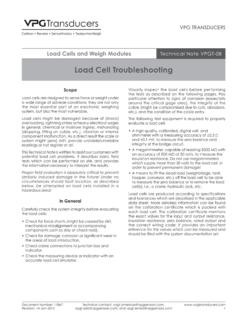
3 Do you remember seeing the spoke wheels of a wagon that appeared to turn backwards as the wagon rolled across a television or movie screen? That s a false visual impression caused by aliasing. When the wheel is rotating at a slightly slower rate than that at which the frames are projected, the wheels appear to run in reverse. Further, if the wheels were rotated at the same rate as the frames are projected, the wheel would appear to be static, or not turning at all! Similar things can happen with an analog Signal that is sampled periodically. Consider a sinusoidal Signal oscillating at, say, 1000 Hz, or 1000 times per second. If we sample this Signal at the same rate as the oscillations (Figure 1), we might think the Signal was static, not varying with sampling between 1000 and 2000 times per second would produce a lower-frequency alias.
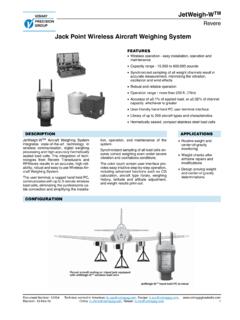
4 Shown here is the 333-Hz alias that we would see at a sample rate of 1333 per second (Figure 2).Sampling at 2000 times per second, the Signal would again appear to be static (Figure 3).So what is it that we must do to ensure that our instrument always sees the wagon wheel turning in the right direction? The answer is to always sample at more than twice the highest rate of oscillation. When sampling at 4000 times a second (Figure 4), we can see that it is impossible to produce either a static or lower-frequency alias from the measurements. 0 1 2 3 Time, msSampling rate: 1000/s Frequency: 1000 HzFigure 1* Scans * * * 0 Time, msSampling rate: 1333/s Frequency: 1000 HzFigure 2* Scans * * * *Tech NoTeFor technical questions, Number: 11067revision: to Digital Signal ProcessingJust how fast should we sample?
5 The mathematics used in Digital Signal Processing can construct a model of the analog waveform that produced a particular set of data by looking at how the magnitudes of the measurements data vary over time. For frequency domain analysis, the sampling rate can be quite close to twice the maximum rate of oscillation. Reconstruction of the actual Signal itself would require a sampling rate of ten or more times the highest Anti-aliasing FiltersIn the general case, we do not know the frequency of any of the oscillations that might be present in the Signal being measured. But, as was just shown, we do know those of half or more the sampling rate will produce aliases during acquisition.
6 Therefore, to ensure that aliases are prevented, it is necessary to remove all components of the Signal and noise with frequencies of half or more the sampling rate with a low-pass anti-aliasing filter. This is an analog circuit through which the input Signal must pass on its way to the analog-to- Digital converter. Of course, the filter not only eliminates any aliasing in the Digital data, but also attenuates any true signals wanted or unwanted above the stopband of the filter. Thus, when the data is subsequently analyzed with Digital Signal Processing , we need not worry about any false lower-frequency signals being left in the data by the analog-to- Digital conversion process.
7 Digital FiltersThe sampling rate of the ADC is typically much higher than that required to extract the necessary information from the Signal within the frequency range of interest. In addition to allowing unwanted higher frequency components (noise) to remain in the data, these higher sampling rates will also increase data storage requirements and analysis preparation for acquiring data in Digital form, the analog Signal being measured is typically passed through an analog filter to ensure that all components of the Signal , and noise with frequencies corresponding to a half, or more, of the Digital sampling rate of the analog-to- Digital converter (ADC), are removed. As described in Section , this helps ensure that false lower-frequency signals called aliases are not introduced into the Digital data by the sampling process order to acquire data at a lower rate while avoiding aliasing errors, it would be necessary to make physical changes to the analog anti-aliasing filter and slow down the sampling rate of the ADC.
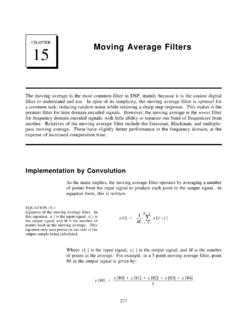
8 The disadvantage of this approach is that different analog filter components are required for each sampling rate. A more practical solution is to leave the analog filter and ADC sampling rate unchanged and to mathematically eliminate any unwanted components from the measured Signal by passing the Digital data through a Digital ically, low-pass Digital f ilters enable the Digital data coming from the ADC to be decimated. Instead of the software Processing and storing data from every analog-to- Digital conversion, the Digital filter allows data to be sampled at intervals corresponding to every nth conversion, effectively reducing the sampling rate without introducing aliases.
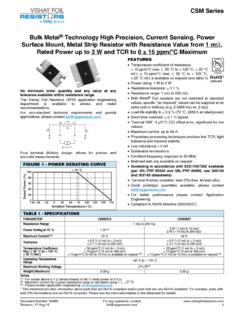
9 And, at the same time, any unwanted higher frequency components of the measured Signal are eliminated from the Digital data as an analog filter, the Digital filter is selected on the basis of which frequencies in the Signal are to be retained and which are to be rejected. Low-pass filters, the most common type, are designed to allow Signal components 0 1 2 3 Time, msSampling rate: 2000/s Frequency: 1000 HzFigure 3* Scans * * * * * *0 1 2 3 Time, msSampling rate: 4000/s Frequency: 1000 HzFigure 4 Scans* * * * * * * * * * * * *Tech NoTeFor technical questions, Micro-MeasurementsDocument Number: 11067revision: to Digital Signal Processingfrom 0 Hz (dc) to some nonzero passband frequency, fo, to pass essentially un altered (Figure 5).
10 The filter does introduce a series of small positive and negative deviations from the actual Signal in the passband. When this ripple exceeds a certain amount, typically dB, it defines the passband frequency. For frequencies in the transition band between the passband frequency and higher stopband frequency, the Signal is increasingly attenuated. When the attenuation reaches a certain level, typically in the vicinity of 95 dB, it defines the stopband frequency of the Digital fi using Digital filters, the user should pay attention to both the stopband and the transition band. In some cases, particularly those with lower passband frequencies, the transition band may be as great as, or even greater than, the passband , as shown in Figure 5, it should be noted that the passband and stopband frequencies of Digital filters differ from the cutoff frequency of the commonly used Bessel and Butterworth analog filters.