Transcription of James Payette,1 Samuel Schwager, and Joseph Murphy
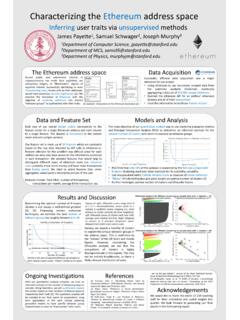
1 Draft version December 16, 2017 Typeset using LATEX default style in AASTeX61 CHARACTERIZING THE ETHEREUM ADDRESS SPACEJ ames payette , 1 samuel schwager ,2and Joseph Murphy31 Department of Computer Science, Stanford University, Stanford, CA 94305, USA2 Department of Mathematical and Computational Science, Stanford University3 Department of Physics, Stanford UniversityABSTRACTA decisive clustering of an inherently anonymous blockchain ecosystem would allow traits of specific users and, morebroadly, overarching user groups to be inferred from publicly available blockchain data. Due to its built-in programminglanguage, the Ethereum blockchain acts as a base layer upon which arbitrary smart contracts and decentralizedapplications can be developed. As such, we postulate that the Ethereum blockchain s formidable functionality andextensibility provide an exceptionally rich set of data compared to other popular blockchain ecosystems and that thisdata can be used to achieve an informed clustering of the Ethereum address space.
2 Utilizing the k-means clusteringalgorithm in conjunction with Calinski-Harabasz scoring, we propose a segmentation of the Ethereum address spaceinto four distinct behavior groups, which we herein discuss and evaluate both quantitatively and :unsupervised learning, clustering, Ethereum, blockchain, cryptocurrency, smart contracts,decentralized applications2 payette , schwager , the advent of Bitcoin, awareness and excitement around cryptocurrencies and the underlying blockchaintechnology that enables them have increased exponentially. Fundamentally, cryptocurrencies provide anonymity inthat users operate via an address or set of addresses devoid of any personal information. However, also fundamental tothe technology is the fact that blockchain data is completely publicly available and could therefore theoretically be usedto successfully characterize or even identify users, resulting in considerable security implications (see Monaco (2015))and other potential consequences and benefits.
3 As such, we sought to gather a comprehensive dataset of Ethereumaddresses and their associated metadata upon which we could apply cluster analysis to then divvy said addresses intobehavior groups sharing similar WORKS everal attempts have been made to identify addresses based on transactions from the Bitcoin blockchain et al. (2013), Neudecker & Hartenstein (2017), Poikonen (2014); however, to our knowledge, this is the firstsuch project focused on the Ethereum address space. Similar to our approach, other projects utilize several clusteringmethods, but k-means seems to be the primary algorithm employed due to its versatility and scalability with largedata main quantitative obstacle we had to navigate was making an educated estimate of the optimal number of clustersto use for learning, as this would inform our qualitative analysis by partitioning the address space into a discrete setof behavior groups.
4 The issue of determining the optimal number of clusters, however, is not always a well-definedproblem. Kodinariya & Makwana (2013) review six different evaluation techniques that range from quantitative toheuristic, including silhouette scoring a measure of inter- and intra-cluster variance and the so-called elbow method ,which attempts to estimate where the returns of adding additional clusters begin to diminish. Tibshirani et al. (2001)attempts to formalize the elbow method in a quantitative framework via the gap statistic. Our analysis has drawnfrom these works as they have guided our choice of clustering algorithms and evaluation metrics. Perhaps the mostimportant upshot in examining related works was determining that the clustering and qualitative analysis of theaddress space is a problem open to experimentation and SET AND FEATURESD espite the public nature of the Ethereum blockchain data, gathering a significant dataset proved to be one of themost formidable challenges we faced throughout the course of our project.
5 We relied on the API for allof our data gathering efforts, and as such were subject to the constraint of a maximum of 5 requests per second. Wecarefully constructed Python scripts that made hundreds of thousands of requests to the API, handling all possibleedge cases and failure scenarios. Ultimately, we were able to gather a dataset consisting of 250,000 addressess alongwith their respective Ethereum balances and full transaction histories. Please find our data collection scripts includedin our code this data, we created a design matrix with each row corresponding to one of the 250,000 addresses and thecolumns corresponding to 34 different features, some of which are included in table 1. Due to the size of our data set,we had to make various algorithmic decisions in order to approach our analysis experimented primarily with three clustering algorithms: k-means clustering, hierarchical or agglomerativeclustering, and Birch clustering.
6 In order to test the efficacy of our clusterings we used unsupervised evaluationmetrics including Calinkski Harabaz scoring as well as heuristic evaluation metrics such as the so-called elbow method as described in Bholowalia & Kumar (2014), for example. Ultimately, we found that k-means, in many respects thesimplest of the three clustering algorithms, combined with Calinkski Harabaz scoring to be the best method of a client-specified number of clusters,K, the k-means algorithm divides the data intoKclusters, generallyunequal in size, with the objective of minimizing the inertia, or the sum of the squared distance between each clusterelement and its cluster centroid. Our analysis utilized the k-means implementation from Pedregosa et al. (2011) [ ], which had the advantage of being very computationally efficient a necessary condition given the size ofour data set.
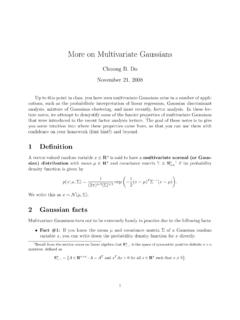
7 While k-means was effective, the algorithm isverysensitive to data outliers. We discuss how this issuewas addressed in section that the problem is unsupervised, evaluation metrics tend to report how well the data has been is, unsupervised evaluation metrics measure intra- and inter-cluster variance to determine how effectively theCharacterizing the Ethereum Address Space3 Figure Harabaz score versus num-ber of clusters using the Birch clustering shown for comparison and corroboration ofk-means result (Figure 2). Note, Birch clusteringwas not pursued because of its poor Harabaz score versus numberof clusters using k-means clustering. Note the max-imum here corresponds with the elbow of theBirch clustering plot, giving us confidence that anoptimal number of clusters is about upon which the clustering algorithm has converged segment the data.
8 The Calinkski Harabaz score is aratio of the inter-cluster dispersion mean and the intra-cluster dispersion mean. As such, a higher score representsa much more distinctive clustering of the data. The Calinski Harabaz score was employed over other unsupervisedmetrics such as a Silhouette score (where a Silhouette score of 1 indicates that a data point is perfectly classified byits cluster centroid and 0 indicates the data point has no preference between any of the clusters) because calculatingthe Calinski score is much more computationally efficient. For example, attempting to run Silhouette analysis on ourentire data set of 250,000 addresses caused our machines to kill the task due to a lack of memory. In this sense, theCalinski Harabaz score is an informative yet practical option for determining cluster , RESULTS, AND DISCUSSIONWe began our experimentation with a dataset of the top 10,000 Ethereum addresses, upon which we ran the k-meansclustering and hierarchical or agglomerative clustering then moved our attention the extensive dataset of 250,000 addresses that we gathered via the We experienced the most success with the k-means and Birch clustering algorithms on this larger dataset, andspecifically had a breakthrough with the k-means algorithm after performing a small amount of preprocessing toremove a small group of outliers that we realized had been distorting our cluster centroids.
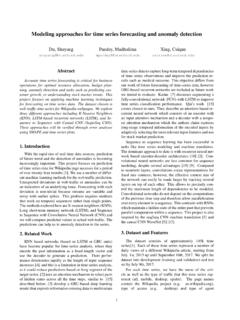
9 By calculating the samplemean and variance vectors for our 250,000-address dataset, we only allowed points satisfying the following criterion toremain post-preprocessing: X X < S (1)Note that above, Xrepresents the sample mean of a clusterk,Xrepresents an arbitrary point ink, andSis a vectorsuch that theith component of S is the standard deviation of theith feature over all points ink. Additionally, notethat the choice of was not arbitrary, but rather the optimal variance threshold we discovered via experimentation(Figure 3).Figure Harabaz Score versus variance threshold hyperparameter. Maximizing the score over our data set corre-sponded to choosing a cutoff variance threshold of , schwager , MurphyTable of interest and their intra-cluster sample means for each of the fourclusters.
10 FeatureCluster 1 Cluster 2 Cluster 3 Cluster 4 Total Number of of Transactions (Incoming) of Transactions (Outgoing) per Month (Incoming) per Month (Outgoing) Movement per Month (Incoming) Movement per Month (Outgoing) Movement per Month (Incoming)23, , , Movement per Month (Outgoing)18, , , Ether Transaction (Incoming) Ether Transaction (Outgoing) USD Transaction (Incoming) , , USD Transaction (Outgoing)16, For each of the sample means of each feature for each cluster, the associatedsample variance is a considerable number of orders of magnitude smaller, so we do notreport the sample variances here. Also, note that we do not report the USD Movementper Month for Cluster 4, as the result seemed suspect. Thus, we threw out the value,given that movement of total Ether contains similar information for our table above provides a comparison between the four clusters that we created using k-means.