Transcription of Key performance indicators - firstgroupplc.com
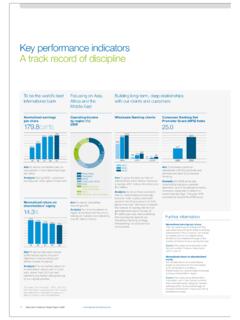
1 Key performance BusGreyhoundFirst Rail2014201820172016201520186, , , , , Focused and disciplined bidding in our contract businessesFirst Student and First Transit contract retention(%)We measure contract retention as a percentage of existing business subject to bid in the year (rather than as a percentage of the contract portfolio as a whole). In First Student and First Transit we typically expect retention of around 90%.In First Student, our 83% contract retention rate during the summer 2017 bid season was slightly lower than we had hoped for but the average price increase was in line with our bidding First Transit, our contract retention rate was 82% during the year, principally reflecting the two shuttle contracts in the Canadian oil sands region that were not renewed in the Group revenue in the year increased by including the new SWR franchise from 20 August 2017, the 53rd week in the Road divisions and the translation of our US dollar-based businesses into pounds Sterling at stronger rates than the prior year.
2 Adjusting for these factors, Group revenue increased by with growth in First Rail, First Transit and First Bus partly offset by small reductions in Greyhound and First Student revenue adjusts for changes in the composition of the divisional portfolio, holiday timing, the 53rd week, severe weather and other factors that distort the year-on-year trends in our passenger revenue the year Greyhound s like-for-like revenue decreased by , reflecting good short haul growth being more than offset by declines in long haul demand, where competition from the ultra low cost airlines has Bus like-for-like passenger revenue growth was , and it accelerated in each quarter of the year, supported by like-for-like commercial passenger volume growth of First Rail, like-for-like passenger revenue growth was , within which the equivalent figure for TPE was , in GWR was , while in our open access operation Hull Trains it was Comparing SWR with the equivalent period under the prior franchise, like-for-like passenger revenue growth was , First Bus and First Rail change in like for like revenue(% change year-on-year)2 Driving growth through attractive commercial propositions in our passenger revenue businessesGroup revenue( m)83%82%FirstGroup Annual Report and Accounts Western RailwaySouth Western Railway2012201320182017201620152014 TransPennine ExpressHull TrainsNational averageOur lost time injury rate has gone up by 1% with increases in our road divisions offset by reductions in First Rail.
3 Total employee injuries went down by 4%, showing that our focus on ensuring employees follow safe systems of work, and tackling unsafe behaviours at source, is working. This remains an area of ongoing focus for our teams. Passenger injuries per million miles have gone up by 4%, primarily driven by increases in Greyhound, First Transit and First Bus. There have been significant reductions in First Rail and First Student. There are proactive ongoing initiatives within each of the divisions, implementing preventative measures to reduce injuries on or around our vehicles, trains and stations. This safety focus remains at the forefront of all our businesses operational operating profit and adjusted EPS highlight the recurring financial results of the Group before amortisation charges and certain other items (as set out in note 4 to the financial statements) which distort year-on-year operating profit in constant currency decreased by , with growth in First Bus and First Rail more than offset by reductions in the other divisions.
4 In reported currency adjusted operating profit decreased by to a constant currency basis, adjusted EPS increased by , while decreasing by in reported currency, reflecting the relative strength of pounds Sterling compared with the prior s on-time performance reduced during the year, partly as a result of poorer fleet reliability as well as delays due to adverse weather. To mitigate this, we are introducing new vehicles, improving our fleet maintenance regime and also continue to roll out automatic GPS tracking, which now covers our Canadian network as well as the US. This enables us to analyse route and driver data to improve First Bus punctuality measures percentage of services no more than one minute early or five minutes late. We continue to work with all local authorities to resolve or mitigate such issues, using our increased access to GPS data to pinpoint problem areas for authorities. In addition our networks saw disruption from adverse weather, particularly in Spring national average score of rail punctuality and reliability (PPM) was flat year-on-year with a number of TOCs affected by substantial infrastructure upgrades on their networks as well as disruption from winter weather.
5 First Rail TOCs have been similarly affected with significant upgrade work taking place across the GWR network at Waterloo station on the SWR network and in the Greater Manchester area on the TPE network. PunctualityGreyhound on time performance1(%)First Bus punctuality(%)3 Continuous improvement in operating and financial performanceFirst Rail Public performance Measure (PPM)(% moving annual average)1 Implemented GPS tracking in 2017; earlier data not comparable due to this change in lost time injury rate(per 1,000 employees per year)Passenger injury rate(per million miles)1 First Rail began operating the SWR franchise from August 2017. The Group safety team worked with the SWR safety analysts to restate and configure safety data in line with the Group safety definitions. SWR safety data was restated for three years from 2015/16 to 2017 performanceAdjusted operating profit( m)Adjusted EPS(pence)FirstGroup Annual Report and Accounts 201831 Strategic reportKey performance indicators201820172016201520140108642 First Student20182017201620152014 Greyhound20182017201620152014 First Prudent investment in our key assets (fleets, systems and people)We carried out a number of Your Voice employee engagement surveys during 2017/18 and will complete surveys for the remainder of the Group later in First Rail businesses once again scored well, with employee engagement scores between 60-88% compared with an external UK benchmark norm of 64%.
6 The First Bus score of 61% represents a 4% improvement on their 2015 scores in our North American divisions ranged from 69-74%, against an external benchmark norm of 68%.First Student continued to make investments in buses during the year and also benefited from cascading buses around our operations; our average fleet age reduced modestly to a number of years where Greyhound required few additional vehicles, this year our fleet renewal plan saw the introduction of 88 new buses into our fleet. As a result our reported average fleet age reduced to years, while adjusting for refurbishment the effective age was significant fleet investment programme in First Bus had led to a number of years where the fleet age reduced, but we are now investing in the fleet at lower levels and therefore the fleet age increased to years. All our recent diesel additions are Euro VI engine return on capital employed (ROCE) is a measure of capital efficiency and is calculated by dividing adjusted operating profit after tax by net assets excluding debt items.
7 Group ROCE was in 2018, with lower adjusted operating profit and lower capital employed as translated at year end currency rates. Group ROCE was at constant exchange rates in the prior year and as reported. The Road divisions ROCE was (2017: at constant exchange rates and as reported). First Student and First Transit continued to maintain high levels of overall customer satisfaction in the year, through continued focus on delivering for our fleet age (Years)Employee engagementYour Voice employee engagement score (%)Group ROCE(%)5 Maintain responsible partnerships with our customers and communitiesCustomer and passenger satisfactionFirst Student(Average rating out of ten)First Transit(Average rating out of ten)First Bus 2018 data calculated on basis of vehicles in service. 2017 data also re-stated on that benchmarkUK 64% North America 68%FirstGroup60% to 88% FirstGroup Annual Report and Accounts 20183220172018-12%+22%201838540020174642 0164854672015201420188484201786201686201 52014847580859095100 Autumn2017 Spring2017 Autumn2016 Spring2016 Autumn2015 Spring2015 Autumn2014 Spring2014 Autumn2013 Spring2013 Great Western RailwaySouth Western RailwayNational averageTransPennine ExpressHull part of Greyhound s business model transformation, we refocused our customer satisfaction KPI on the Net Promoter Score (NPS) methodology in 2016.
8 This improved significantly in 2017, but dipped in 2018 as on-time performance grew weaker. We are taking action to address this through improvements to fleet maintenance and focus on First Bus, overall satisfaction in the independent transport focus national bus passenger survey remains high and this year, in particular, our value for money scores increased. In the Welsh survey our First Cymru business scored highly and was the top operator. Similarly in Scotland, First Glasgow came through well and with a significantly improved score, being the second best operator in Scotland. Our First York, First Scotland East and First Leicester businesses also saw high overall scores this year. The latest independent Transport Focus national rail passenger survey saw overall satisfaction nationally at similar levels to last year, but the survey showed significant year-on-year increases in customer satisfaction in 17 of the 38 categories. Hull Trains again scored very highly for overall satisfaction whereas GWR saw a slight reduction.
9 For SWR, the survey was undertaken during the weeks following extensive work to lengthen platforms at Waterloo, leading to a reduction in satisfaction scores although there were some areas where satisfaction has risen, such as the attitude and helpfulness of our staff, Wi-Fi availability and ticket buying facilities. TPE saw an overall reduction of 3%, but satisfaction with stations was marked highly, as customers noted improvements in the availability of seating, shelter facilities and year we contributed to the communities we serve across the UK and North America. This was measured by using the method of the London Benchmarking Group (LBG) model which tracks cash contributions made directly by the Group, time (employee volunteering), in-kind support (such as travel tickets, advertising space) and leverage (including contributions from other sources such as employees, customers and suppliers).The large increase from last year s total community investment figure is due primarily to increased data collection across the Group and more established processes in place to measure the positive contributions we re making.
10 We also made a significantly higher contribution to our charity partner in 2018 around 1m in emissions are calculated in line with the requirements of the WRI/WBCSD GHG Protocol. We report our emissions from all activities for which we are responsible across our operations expressed in tonnes of carbon dioxide equivalent (CO2(e)), normalised per 1m data has been re-baselined to reflect the new addition of the SWR rail franchise in accordance with our stated re-baselining policy. In 2018, our normalised emissions decreased by 4% against 2017 and passenger satisfaction continuedGreyhound(Change in Net Promoter Score)1 First Bus(% satisfied with their journey overall) First Rail(% satisfied with their journey overall)Total FirstGroup community investment( m measured using the LBG model)EnvironmentGreenhouse gas emissions(Tonnes of carbon dioxide equivalent per 1m of revenue)Data from 2016 onwards now includes emissions attributed to the waste we produce through our Moved to NPS methodology in late 2016; earlier data not comparable due to this Annual Report and Accounts 201833 Strategic report