Transcription of Lab 03: Resistance and Resistivity
1 L a b 0 3 : R e s i s t a n c e a n d ResistivityINTRODUCTIONR esistivity is the tendency of a material to behave as a resistor. You already know that not everything conducts electricity equally well, and that some materials (like copper) resist very little, while others (like rubber) provide enough Resistance to effectively prevent the flow of current. Resistivity is a fundamental material property (like density or melting point), while the total Resistance (R) depends on the material, the geometry, and the temperature. The dependence on geometry (really, a volume dependence: cross-sectional area (A) and length(L)) can be quantified: R= LAwhere is the Resistivity . As you might expect, a longer wire (of any material) creates greater Resistance , and a fatter wire (greater cross-section) reduces total Resistance .
2 We can easily test the length dependence, and simultaneously find the Resistivity of an unknown Use Ohm s Law to establish the dependence of Resistance on length Distinguish between Resistance and Resistivity Find the Resistivity of a given wire and from this determine the materialEQUIPMENT DC power supply Electrical wires Vernier LabQuest Current and voltage probes Potentiometer board Vernier calipersEXPERIMENTAL PROCEDURE The current and voltage probes are extremely sensitive, and can be permanently damaged by overloading them. The current probe will be literally destroyed by currents greater than The voltage probe is limited to 6V. It is slightly more forgiving, but will also be rendered permanently inoperable by exposure to voltages greater than 6V. It is necessary to set the power supply to limit the maximum current output.
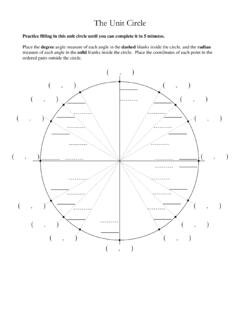
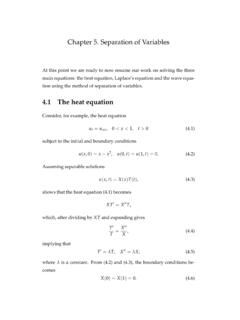
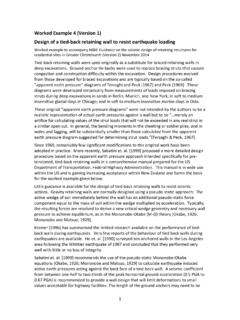
3 We will always use the power supply in constant voltage (CV) mode. The power supply has both coarse and fine adjustments for both current and voltage. It also has a HI LO range selector. When the selected range is LO, the maximum current in CV mode will be With the power supply off, zero all of the control knobs to the left (anti clockwise). Now adjust the fine control of the current to maximum (clockwise). The coarse control remains at zero. When you switch the power supply on, you will adjust only the voltage to power your circuit. TheThis is the same circuit you built last week!This is the same circuit you built last week! The adjustablepotentiometer replaces the resistor on the circuit 1420: College Physics II Summer 2018 Course Web: page 01/02current will never exceed Note that you are not voltage limited, so you must still be careful not to exceed 6V.
4 Use the circuit diagram and the photograph above to set up the potentiometer as the resistor in the DC circuit. The sliding scale can be adjusted to create a complete circuit with a specific length of resisting wire. Each of the four buttons shown can be depressed (one at a time!) to complete the circuit. Pay careful attention to which contact you are using, and the corresponding length of wire! For ten different length of potentiometer wire, collect voltage and current data using the same method as last week. Make sure to very carefully keep track of the length of wire. Save each data set (tap the File Cabinet icon on the graph tab) before proceeding to the next and record the diameter (d) of the wire using the vernier calipers. Use this to calculate the cross-sectional area of the you have not already, graph the voltage and current data for each length of wire.
5 The slope of each line is the Resistance for that specific length of wire. Keep track by making a table of values for length of wire and corresponding the Resistivity ( ) and area (A) of the wire are constant, the Resistance is directly proportional to the length: R= A Lwhere ( /A) is the proportionality constant, or slope of the R vs. L curve. Graph this data, fit the curve, and extract the slope. It should be quick and simple to use a spreadsheet to make this the Resistivity of your wire: slope= A= r2 OR =slope() r2()where slope is the slope of your R vs. L curve and r is the radius of the wire (r = d). Compare this value to Table at the top of the page, and determine the material of the wire. How close did you get to the actual value? Calculate the percent error in your experimental 03 With your lab partners, prepare a data sheet and summary of this experiment.
6 You should include: A table with your data neatly the appropriate units! This does not need to include each V vs I table and graph generated for each individual trial completed using the LabQuest. The graph of Resistance vs. should have the axes properly labeled and scaled, and include the best-fit line. Make it easy to read and interpret! The calculated all your calculations. This includes the area, resisitivity, and percent error based on your identification of the wire s most probable composition. A brief comment on the success of your close did you get to the expected value? Name at least two sources of experimental uncertainty. You may submit you are not able to send your work to the printer in CCCS 101. Upload directly to the shared folder on the Google drive for which you have been sent a specific link, share a Google doc or sheet directly with me, or e-mail your file.
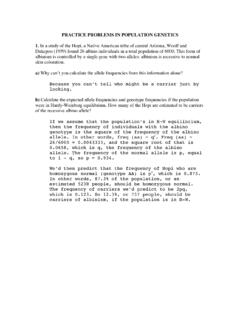
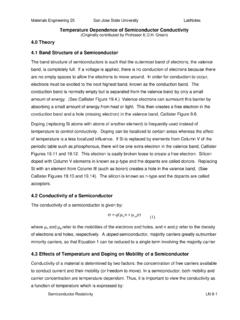
7 Submit your work no later than 9:40 AM Tuesday morning, 17 be sure to include the names of all group participants. All group members will receive the same score for this graph may (or may on the material) have a slope resembling this 1420: College Physics II Summer 2018 Course Web: page 02/02