Transcription of Language Use and English-Speaking Ability: 2000
1 The ability to commu-nicate with govern-ment and private serv-ice providers, schools,businesses, emergencypersonnel, and manyother people in theUnited States dependsgreatly on the ability tospeak 2000, as in thetwo previous censuses,the Census Bureauasked people aged 5and over if they spokea Language other thanEnglish at the mil-lion people aged 5 andover, million (18 percent) spoke alanguage other thanEnglish at report, part of a series that presentspopulation and housing data collected inCensus 2000, presents data on languagespoken at home and the ability to speakEnglish of people aged 5 and over. Itdescribes population distributions andcharacteristics for the United States,including regions, states, counties, andselected places with populations of100,000 or questions illustrated in Figure 1 wereasked in the census in 1980, 1990, and 2000. Various questions on languagewere asked in the censuses from 1890 to1970, including a question on mothertongue (the Language spoken in the per-son s home when he or she was a child).
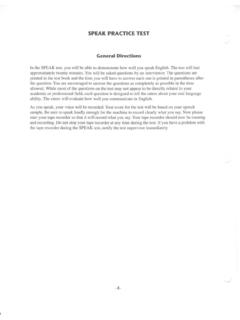
2 The first Language question in Census2000 asked respondents whether theyspoke a Language other than english athome. Those who responded Yes toQuestion 11a were asked what languagethey spoke. The write-in answers toQuestion 11b (specific Language spoken)were optically scanned and linguists recognize severalthousand languages in the world, thecoding operation used by the CensusBureau put the reported languages intoU S C E N S U S B U R E A UHelping You Make Informed Department of CommerceEconomics and Statistics CENSUS BUREAUI ssued October 2003C2 KBR-29 Language Use and English-Speaking ability : 2000 Census 2000 BriefBy Hyon B. ShinwithRosalind Brunoa. Does this person speak a Language other thanEnglish at home?YesNo Skip to 12b. What is this Language ?(For example: Korean, Italian, Spanish, Vietnamese)c. How well does this person speak english ?Very wellWellNot wellNot at allFigure of the Questions on Language From Census 2000 Source: Census Bureau, Census 2000 text of this report discusses data for theUnited States, including the 50 states and theDistrict of Columbia.
3 Data for the Commonwealth ofPuerto Rico are shown in Table 2 and Figure Census Bureauabout 380 categories of single lan-guages or Language people who answered Yes toQuestion 11a, Question 11c askedrespondents to indicate how wellthey spoke english . Respondentswho said they spoke english Verywell were considered to have nodifficulty with english . Those whoindicated they spoke english Well, Not well, or Not at all were con-sidered to have difficulty withEnglish identified also as peoplewho spoke english less than Very well. The number and percentage of people in the United Stateswho spoke a Language otherthan english at home increasedbetween 1990 and 2000, 18 percent of the totalpopulation aged 5 and over, or million people, reported theyspoke a Language other thanEnglish at figureswere up from 14 percent ( mil-lion) in 1990 and 11 percent ( million) in 1980. The numberof people who spoke a languageother than english at home grew by38 percent in the 1980s and by 47 percent in the 1990s.
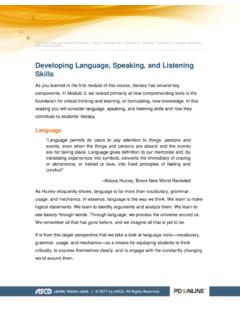
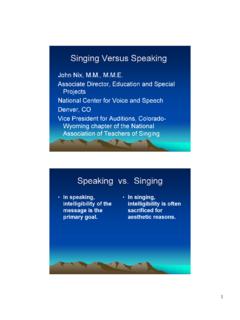
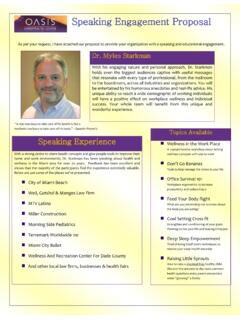
4 While thepopulation aged 5 and over grewby one-fourth from 1980 to 2000,the number who spoke a languageother than english at home morethan 2000, most people who spoke alanguage other than english athome reported they spoke english Very well (55 percent or 2 More detailed information on languagesand Language coding can be found in Summary File 3: 2000 Census of Populationand Housing Technical Documentation issuedDecember 2002 ( ).3 The estimates in this report are based onresponses from a sample of the with all surveys, estimates may vary fromthe actual values because of sampling varia-tion or other factors. All statements made inthis report have undergone statistical testingand are significant at the 90-percent confi-dence level unless otherwise of Languages Other Than english at Homeand english ability by Language Group: 2000 Source: Census Bureau, Census 2000 Summary File 3.(Population 5 years and over, in millions. Data based on sample. For information on confidentiality protection, nonsampling error, sampling error, and definitions, see )Spoke english "Very well"Spoke english less than "Very well"All otherlanguagesAsian and PacificIsland languagesOther Languages Most Frequently Spoken at Home Other Than english and Spanish: 20001 The number of Vietnamese speakers and the number of Italian speakers were notstatistically different from one : The estimates in this figure vary from actual values due to sampling errors.)
5 Asa result, the number of speakers of some languages shown in this figure may not be statistically different from the number of speakers of languages not shown in this : Census Bureau, Census 2000 Summary File 3.(Population 5 years and over, in millions. Data based on sample. For information on confidentiality protection, nonsampling error, sampling error, and definitions, see ) million people). When theyare combined with those whospoke only english at home, 92 percent of the population aged5 and over had no difficulty speak-ing english . The proportion of thepopulation aged 5 and over whospoke english less than Very well grew from percent in 1980, percent in 1990, and to in Figure 2, the number of speak-ers of the four major languagegroups (Spanish, Other Indo-European languages, Asian andPacific Island languages, and Allother languages) are shown byhow well they spoke english (seetext box above). Spanish was thelargest of the four major languagegroups, and just over half of million Spanish speakersspoke english Very well.
6 Other Indo-European languagespeakers composed the secondlargest group, with millionspeakers, almost two-thirds ofwhom spoke english Very well. Slightly less than half of the million Asian and Pacific Island- Language speakers spoke english Very well ( million). Of the million people who composedthe All other Language category, million spoke english Very well. After english and Spanish, Chinesewas the Language most commonlyspoken at home ( million speak-ers), followed by French ( mil-lion speakers) and German ( million speakers, see Figure 3).Reflecting historical patterns ofimmigration, the numbers ofItalian, Polish, and German speak-ers fell between 1990 and 2000,while the number of speakers ofmany other languages increased. Spanish speakers grew by about 60 percent and Spanish continued tobe the non- english Language mostfrequently spoken at home in theUnited States. The Chinese lan-guage, however, jumped from thefifth to the second most widely spo-ken non- english Language , as thenumber of Chinese speakers rosefrom to million people (seeTable 1).
7 4 The number of Viet-namese speakers doubled over thedecade, from about 507,000 speak-ers to just over 1 million the 20 non- english languagesmost frequently spoken at homeshown in Table 1, the largest pro-portional increase was for Russianspeakers, who nearly tripled from242,000 to 706,000. The secondlargest increase was for FrenchCreole speakers (the languagegroup that includes HaitianCreoles), whose numbers more thandoubled from 188,000 to 453, GEOGRAPHICDISTRIBUTION OF PEOPLEWHO SPOKE A LANGUAGEOTHER THAN english AT HOMEThis section discusses the geo-graphic distribution of the popula-tion aged 5 and over who stated inCensus 2000 that they spoke a lan-guage other than english at West had the greatestnumber and proportion of non- english - Language who spoke languages otherthan english at home were not dis-tributed equally across or withinregions in the Census Bureau3 Four Major Language GroupsSpanishincludes those who speak Indo-European languagesinclude most languages ofEurope and the Indic languages of India.
8 These include the Germaniclanguages, such as German, Yiddish, and Dutch; the Scandinavianlanguages, such as Swedish and Norwegian; the Romance languages,such as French, Italian, and Portuguese; the Slavic languages, such asRussian, Polish, and Serbo-Croatian; the Indic languages, such asHindi, Gujarathi, Punjabi, and Urdu; Celtic languages; Greek; Balticlanguages; and Iranian languages. Asian and Pacific Island languagesinclude Chinese; Korean;Japanese; Vietnamese; Hmong; Khmer; Lao; Thai; Tagalog or Pilipino;the Dravidian languages of India, such as Telegu, Tamil, andMalayalam; and other languages of Asia and the Pacific, including the Philippine, Polynesian, and Micronesian other languagesinclude Uralic languages, such as Hungarian;the Semitic languages, such as Arabic and Hebrew; languages ofAfrica; native North American languages, including the AmericanIndian and Alaska native languages; and some indigenous languagesof Central and South America. 4 The changes in ranks between 1990and 2000 have not been tested and may notbe statistically , this report uses the term non- english - Language speakers to refer topeople who spoke a Language other thanEnglish at home, regardless of their ability tospeak english (see Table 1).
9 6 The Northeast region includes the statesof Connecticut, Maine, Massachusetts, NewHampshire, New Jersey, New York,Pennsylvania, Rhode Island, and Vermont. TheMidwest region includes the states of Illinois,Indiana, Iowa, Kansas, Michigan, Minnesota,Missouri, Nebraska, North Dakota, Ohio,South Dakota, and Wisconsin. The Southregion includes the states of Alabama,Arkansas, Delaware, Florida, Georgia,Kentucky, Louisiana, Maryland, Mississippi,North Carolina, Oklahoma, South Carolina,Tennessee, Texas, Virginia, West Virginia, andthe District of Columbia, a state West region includes the states of Alaska,Arizona, California, Colorado, Hawaii, Idaho,Montana, Nevada, New Mexico, Oregon, Utah,Washington, and only slightly more than one-fifth of the populationaged 5 and over, it was home tomore than one-third (37 percent) ofall non- english - Language speakers,the highest proportion of anyregion (see Table 2). Withinregions, the proportion who spokea non- english Language at homewas 29 percent in the West, 20 percent in the Northeast, 15 percent in the South, and only9 percent in the the higher proportion ofspeakers of non- english languagesin the West, people in that regionwere more likely than those in theother regions to have difficultywith english .
10 In 2000, 14 percentof all people aged 5 and over inthe West spoke english less than Very well compared with 9 percent in the Northeast, 7 per-cent in the South, and 4 percent inthe 4 illustrates the prevalenceof the four major non- english - Language groups spoken in eachregion. Spanish was spoken morethan any other Language group inall regions. The West and the Southcombined had about three timesthe number of Spanish speakers( million) as the Northeast andthe Midwest combined ( million).In the Northeast and the Midwest,Spanish speakers composed slightlyless than half of all non- english -lan-guage speakers, while in the Southand the West, they representedaround two-thirds (71 percent and64 percent, respectively), in largepart because of the geographicproximity to Mexico and otherSpanish- speaking Census BureauTable Languages Most Frequently Spoken at Home by english ability for thePopulation 5 Years and Over: 1990 and 2000(Data based on sample. For information on confidentiality protection, sampling error, nonsampling error, and definitions, ) Language spokenat home19902000 RankNumber ofspeakers RankNumber of speakersTotalEnglish- speaking abilityVery wellWellNot wellNot at allUnited (X)230,445,777(X) 262,375,152(X)(X)(X)(X) english (X)198,600,798(X) 215,423,557(X)(X)(X)(X)Total (X)31,844,979(X)46,951,59525,631,18810,3 33,5567,620,7193,366, ,339,172128,101,05214,349,7965,819,4085, 130,4002,801, ,249,21322,022,143855,689595,331408,5971 62, ,702,17631,643,8381,228,800269,458138,00 27,578 German.