Transcription of Lecture 4: Poisson Approximation to Binomial Distribution ...
1 Lecture 4: Poisson Approximation to Binomial Distribution ; Measures of Center and Variability for Data (Sample); Chapter 2 No Lab this week, Questions in Lab# 2 are related to this week s Hw#2 is due by 5pm, next Monday Poisson Approximation for the Binomial Distribution For Binomial Distribution with large n, calculating the mass function is pretty nasty So for those nasty large Binomials (n 100) and for small (usually ), we can use a Poisson with = n ( 20) to approximate it! Example Density (for Continuous) and Mass (for Discrete) functions tell you the chance/proportion/probability that a variable takes a certain value Need to know the Distribution expression both used to rigorously describe populations or processes How to know which Distribution is applicable?
2 See Chapter 2 Numerical measures for both samples and populations Bring Your Calculator from now Measures of Center (Data) The sample mean arithmetic average From a sample of n observations, x1, x2,..xn, the mean is given by: =+++= Scores for 10 students are: 80 85 81 87 78 82 80 83 85 86 So, +++= ixxMeans: not resistant to Scores for 11 students are: 80 85 81 87 78 82 80 83 85 86 2 So, What does this say about the mean? ++++= ixxMeasures of Center (Data) The sample median midpoint From a sample of n observations, x1, x2,..xn, the median is given by Intuitively, it is the middle observation (in an ordered list) Examples Scores for 10 students are: 80 85 81 87 78 82 80 83 85 86 Step 1: Reordered observations: 78 80 80 81 82 83 85 85 86 87 Step 2: n=10, an even number.
3 So take the average of 5th and 6th observation (in the sorted list) () ~=+=xMedian: a more resistant measure of center Scores for 11 students are: 80 85 81 87 78 82 80 83 85 86 2 Reordered, 2 78 80 80 81 82 83 85 85 86 87 position, What does this say about the median? thn621=+82~=xTrimmed Means (page 62) Rank the observations from smallest to largest, then trim off a percentage from both ends of the data before taking the mean So for our example with 11 students: 2 78 80 80 81 82 83 85 85 86 87 We could trim off say 1/11 or 9% from each end (just one value) 78 80 80 81 82 83 85 85 86 Trimmed mean is Review Up to Now: Measure of center of Data (Sample) Sample mean Sample median Trimmed means Later, Measure of variability for Data (Sample) Sample variance Standard deviation And.
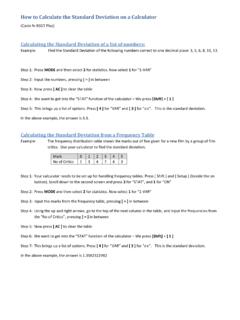
4 Measure of Center for Distributions - Population Mean/ Expected Value; - Population Median, for continuous distributions. how to measure variability for distributions (Population) graphically display both the center and variability of Data (Sample); Standard deviation for Data deviation : Variance : s2 Standard deviation : s xxi () = ++ + =2222212111)(..)()(xxnnxxxxxxsin() ==2211xxnssiDATA: 1792 1666 1362 1614 1460 1867 1439 Mean = 1600 Find the deviations from the mean: Deviation1 = 1792 1600 = 192 Deviation2 = 1666 1600 = 66 .. Deviation7 = 1439 1600 = -161 Square the deviations.
5 Add them up and divide the sum by n-1 = 6, this gives you s2. n-1: degrees of freedom. Take square root: Standard deviation = s = Measures of Variability (Data) The sample variance, s2 From a sample of n observations, x1, x2,..xn, the sample variance is given by Why divide by n 1? From the degrees of freedom The sample standard deviation , s Just take the square root of the variance 2ss=Example Scores for 10 students are: 80 85 81 87 78 82 80 83 85 86 Calculations on Mean = , OR just plug into calculator s= After Class .. Start Hw#2 now Review sections and , especially Pg 63 68, 74 77 Read section , self-reading Pg95