Transcription of Mid-Cap Growth Equity Fund
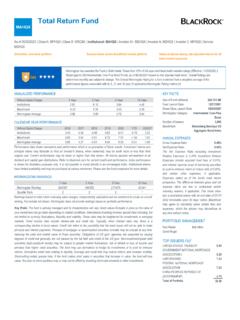
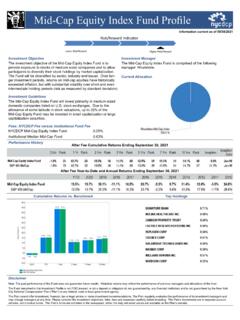
1 Mid-Cap Growth Equity fund BMGAX. As of 09/30/2021 | Class K: BMGKX | Class R: BMRRX | Institutional: CMGIX | Investor A: BMGAX | Investor C: BMGCX | Service: CMGSX. A high conviction, Mid-Cap Growth strategy Combines diversified sources of Growth Seeks to outperform in all markets Morningstar has awarded the fund a Bronze medal (Effective 06/09/2021). Rated against 549 Mid-Cap Growth Funds, as of 09/30/2021. based on risk adjusted total return. Overall Ratings are determined monthly and subject to change. The Overall Morningstar Rating for a fund is derived from a weighted average of the performance figures associated with its 3-, 5- and 10-year (if applicable) Morningstar Rating metrics.. ANNUALIZED PERFORMANCE KEY FACTS. With Sales Charge 1 Year 3 Year 5 Year 10 Year Size of fund (Millions) $17, Investor A fund Launch Date 12/27/1996. Without Sales Charge 1 Year 3 Year 5 Year 10 Year Share Class Launch Date 12/27/1996. Investor A Morningstar Category Mid-Cap Growth Benchmark Number of Holdings 66.
2 Morningstar Average Benchmark Russell MidCap Growth Index CALENDAR YEAR PERFORMANCE ANNUAL EXPENSES. Gross Expense Ratio Without Sales Charge 2016 2017 2018 2019 2020 YTD 3Q2021 Net Expense Ratio Investor A The Net Expense Ratio excluding Investment Benchmark Related Expenses is Investment Related Morningstar Average Expenses include acquired fund fees of , Performance data shown represents past performance which is no guarantee of future results. Investment returns and and interest expense (cost of borrowing securities principal values may fluctuate so that an investor's shares, when redeemed, may be worth more or less than their to seek to enhance return or reduce risk) of , original cost. Current performance may be lower or higher than that shown. All returns assume reinvestment of all and certain other expenses, if applicable. dividend and capital gain distributions. Refer to for current month-end performance. Index performance Expenses stated as of the fund 's most recent is shown for illustrative purposes only.
3 It is not possible to invest directly in an unmanaged index. Returns with sales prospectus. The difference between gross and net charge reflect the deduction of current maximum initial sales charge of calendar year performance shown expense ratios are due to contractual and/or does not reflect the deduction of the sales load. If reflected, the performance would have been lower. Please see the voluntary waivers, if applicable. This share class fund prospectus for more details. has a contractual waiver with an end date of 06/30/. 2023 terminable upon 90 days' notice. BlackRock MORNINGSTAR RANKINGS may agree to voluntarily waive certain fees and 1 Year 3 Year 5 Year 10 Year expenses, which the adviser may discontinue at Morningstar Ranking 177/584 103/549 38/495 12/386 any time without notice. Quartile Rank 2 1 1 1. PORTFOLIO MANAGEMENT. Rankings based on total return excluding sales charges, independently calculated and not combined to create an overall ranking.
4 For periods not shown, Morningstar does not provide rankings based on synthetic performance. Phil Ruvinsky Lawrence Kemp Key Risks: The fund is actively managed and its characteristics will vary. Holdings shown should not be deemed as a TOP HOLDINGS (%)2. recommendation to buy or sell securities. Stock and bond values fluctuate in price so the value of your investment can go MSCI INC down depending on market conditions. Investing in Mid-Cap companies may entail greater risk than large-cap companies, PAYCOM SOFTWARE INC due to shorter operating histories, less seasoned management or lower trading volumes. The fund may use derivatives to MONGODB INC hedge its investments or to seek to enhance returns. Derivatives entail risks relating to liquidity, leverage and credit that COPART INC. may reduce returns and increase volatility. Performance may be attributable to unusually high IPO profits. There is no VEEVA SYSTEMS INC guarantee this level of performance will be repeated.
5 IPO securities have no trading history and the price may be volatile. WEST PHARMACEUTICAL SERVICES INC IDEXX LABORATORIES INC. ENTEGRIS INC CHARLES RIVER LABORATORIES. INTERNATIONAL INC CADENCE DESIGN SYSTEMS INC Total of Portfolio TOP SECTORS (%)2 MARKET CAPITALIZATION (%)2. fund Benchmark Active fund Benchmark Active Information Technology Cash and Derivatives Health Care Large Cap ->$10bn Consumer Discretionary Mid Cap - $2-$10bn Industrials Small Cap -<$2bn Financials Communication RISK STATISTICS (3 YEARS). Cash and/or Derivatives Real Estate fund Benchmark Energy Alpha - Materials Beta - Utilities R-Squared - Consumer Staples Standard Deviation Sharpe Ratio PORTFOLIO CHARACTERISTICS. Forward Price to Earnings Price to Book Ratio Average Market Capitalization (millions) $25, 2% of net assets represents the fund 's exposure based on the economic value of securities and is adjusted for futures, options, swaps, and convertible bonds. Allocations subject to change.
6 Price to Earnings Ratio: The price-to-earnings ratio is used to assess a company's valuation. To compute this ratio, the latest closing price is divided by the company's last fiscal year's Earnings Per Share. The ratio represents a weighted harmonic mean of the price-to-earnings ratios of its holdings with negative values being excluded from the calculation. Price to Book Ratio: represents the ratio of the current closing price of the share to the latest quarter's book value per share. Average Market Cap: The average size of the securities the fund invests in. Alpha: A measure of performance on a risk-adjusted basis. Alpha takes the volatility (price risk) of a mutual fund and compares its risk-adjusted performance to a benchmark index. The excess return of the fund relative to the return of the benchmark index is a fund 's alpha. Beta: Beta measures the funds sensitivity to market movements beta greater than 1 is more volatile than the market beta less than 1 is less volatile than the market.
7 R-Squared: R-Squared reflects the percentage of a funds movements that are explained by movements in its benchmark, showing the degree of correlation between the fund and benchmark. This figure is helpful in assessing how likely it is that beta is statistically significant. Standard Deviation: Standard Deviation measures the volatility of the funds returns. Higher deviation represents higher volatility. Sharpe Ratio: Sharpe Ratio uses a funds standard deviation and its excess return (difference between the funds return and the risk-free return of 90-day Treasury Bills) to determine reward per unit of risk. You should consider the investment objectives, risks, charges and expenses of the fund carefully before investing. The prospectus and, if available, the summary prospectus contain this and other information about the fund and are available, along with information on other BlackRock funds, by calling 800-882-0052 or from your financial professional. The prospectus should be read carefully before investing.
8 Investing involves risks including possible loss of principal. The Morningstar Analyst Rating is not a credit or risk rating. It is an evaluation performed by Morningstar's Manager Research Group. The funds are evaluated on five pillars: process, performance, people, parent, and price. This evaluation determines how they believe funds are likely to perform relative to a benchmark over the long term on a risk-adjusted basis. They consider quantitative and qualitative factors. For active funds, an Analyst Rating of Gold, Silver, or Bronze reflects the expectation that the fund will be able to deliver positive alpha net of fees relative to the standard benchmark index assigned to the Morningstar category. The Analyst Ratings are overseen by an Analyst Rating Committee and are monitored and reevaluated at least every 14 months. For more detailed information about Morningstar's Analyst Rating, including its methodology, please go to The Morningstar Analyst Rating (i) should not be used as the sole basis in evaluating a fund , (ii) involves unknown risks and uncertainties which may cause the Manager Research Group's expectations not to occur or to differ significantly from what they expected, and (iii) should not be considered an offer or solicitation to buy or sell the fund .
9 The Morningstar RatingTM for funds, or "star rating", is calculated for managed products (including mutual funds, variable annuity and variable life subaccounts, exchange-traded funds, closed-end funds, and separate accounts) with at least a three-year history. Exchange-traded funds and open-ended mutual funds are considered a single population for comparative purposes. It is calculated based on a Morningstar Risk-Adjusted Return measure (excluding any applicable sales charges) that accounts for variation in a managed product's monthly excess performance, placing more emphasis on downward variations and rewarding consistent performance. The top 10% of products in each product category receive 5 stars, the next receive 4 stars, the next 35% receive 3 stars, the next receive 2 stars, and the bottom 10% receive 1 star. The Overall Morningstar Rating for a managed product is derived from a weighted average of the performance figures associated with its three-, five-, and 10-year (if applicable) Morningstar Rating metrics.
10 The weights are: 100% three-year rating for 36-59 months of total returns, 60% five-year rating/40% three-year rating for 60-119 months of total returns, and 50% 10-year rating/30% five-year rating/20%. three-year rating for 120 or more months of total returns. While the 10-year overall star rating formula seems to give the most weight to the 10-year period, the most recent three-year period actually has the greatest impact because it is included in all three rating periods. The fund was rated against the following numbers of Mid-Cap Growth funds over the following time periods: 549 in the last 3 years, 495 in the last 5 years and 386 in the last 10 years. With respect to these Mid-Cap Growth funds, the fund received a Morningstar Rating of 4, 5 and 5 stars for the 3-, 5- and 10-year periods, respectively. Other classes may have different performance characteristics. The unmanaged Russell Midcap Growth Index consists of the bottom 800 securities of the Russell 1000 Index with greater-than-average Growth orientation as ranked by total market capitalization.