Transcription of MINI PAPER - ASQ
1 16 ASQ STATISTICS DIVISION NEWSLETTER, VOL. 18, NO. 1 process capability indices have been popular for over20 years, since Joseph Juran12popularized the CapabilityRatio (Cr) in his Quality control Handbook. Eagerness toestablish a single index to measure process capability hasresulted in the proliferation of indices: Cp/Cpk, Vp/Vpk,Pp/Ppk, Cpm, Tz, %OOL, PPM, and more recently Generalized Cp/Cpk. Abuse of these indices is welldocumented (Gunter)8. Though simple to compute, theycan lead to scorekeeping by management, incorrect inter-pretations and tampering, with little or no product orprocess improvement. This article reviews the basics ofestimating process capability and introduces new processcapability , CpkThe original Capability Index published in Juran sQuality control Handbookis defined as Tolerance Widthdivided by process = process Potential = (Tolerance Width) / ( process Capability).
2 Juran defines process Capability as six standard deviationsfor a process in statistical control . process Capability=6 where is the in- control process standard easiest method to determine process standard devia-tion is from the control chart of a stable process : ProcessStd. Dev. = R-bar/d2, where the appropriate value of d2isread from a table for the subgroup size. For the Cp/Cpk index to be valuable, the tolerancewidth, or specification range, should have real meaning, be based on functional limits per known end-userrequirements ( Voice of the Customer ). Occasionally, forlack of end-user requirements, one is asked to set specifi-cations (specs) based solely on the producer s processcapability. The danger is that a process aim and naturalvariation can have little relation to customer-perceivedquality.
3 How does one choose specs: use arbitrarily widelimits (+/- 6s) to ensure good Cpk values? Use arbitrarilynarrow limits in an effort to lock out competition (andunwittingly, perhaps yourself)? Neither strategy focuses onthe customer. Furthermore, focusing on specs alone asks, What is the worst we can get away with? while emphasison target alignment and variability reduction asks, Whatis the best we can do? According toQuality Assurance for the Chemical andProcess Industries A Manual of Good Practices 2ndEdition1:Values of Cp exceeding indicate that the process is adequate tomeet the specifications. Values of Cp between and indicate thatthe process , while adequate to meet specifications, will require closecontrol.
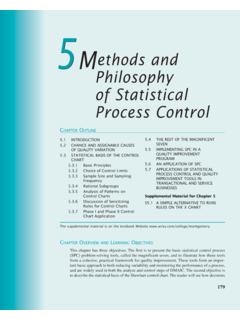
4 Values of Cp below indicate the process is not capable ofmeeting is called the process Potential - it simply relatesthe process Capability (6 ) to the Spec Range; it does notrelate the location of the process with respect to the the three distributions in fig. 1, all from pro-cesses having a Cp of or 1If the process is centered within the specs, and is approxi-mately normal then Cp = results in a fraction non-conforming ( ) of Note that Cp= doesn tguarantee that there will be only non-conformingproduct. What it does guarantee is that, assumingnormality, a stable process centered with respect to thespecs, and the correct value of , there will not be lessthan of non-conforming process Capability is used to summarize how a process is runningrelative to its spec limits.
5 As with Cp, this measure isappropriate only when the process is stable (in- control ).Cpk = minimum of X bar - LSL, USL - X bar3 { }where Xbar and are the mean and standard deviation ofthe process . So, Cpk measures how far the process meanis from the nearer spec limit in terms of 3 distances. Forprocesses with a one-sided spec the term correspondingto the missing limit is PAPERP rocess Capability IndicesBy Robert H. Mitchell3M CompanyASQ STATISTICS DIVISION NEWSLETTER, VOL. 18, NO. 117 Special consideration must be made for non-normal dis-tributions. Cpk works well only for the bell-shaped nor-mal (Gaussian) distribution. For others it is an approxima-tion. Unlike Xbar control charts there is no Central LimitTheorem effect in estimating process capability becauseCp and Cpk relate to the distribution of need to be concerned about non-normal 1 gives the fraction non-conforming (PPM) for dif-ferent distributions, all having Cpk= ( )14,000 Heavy-tailed (B2>3)4,000 Uniform0 Normal2700 One approach to dealing with non-normal data is totransform the data.
6 Typical transformations include takingthe reciprocal, reciprocal square root, natural log, orsquare root of the raw data. The corresponding spec limitsmust be similarly transformed. Box, Hunter, and Hunter5offer a relatively simple method for determining a trans-formation to give constant variance. Theoretical Cp, CpkCp* and Cpk* are calculated when the process is notstable, yet one desires to estimate how good the processmight be if no Special Causes existed. Theoretical Cp,Cpkuse a best estimate of the true process standarddeviation (sigma-hat). Special Causes are excluded fromthe data when appropriate, to estimate the potential natural process variation. A theoretical process sigma-hatis calculated and Cp*/Cpk* general, I advise against this methodology becauseof potential confusion.
7 Although meant as a measure ofhow good the process might be, one cannot predict sincethe process is not stable. These are not true Cp, , PpkPp and Ppk are measures of process performance froma customer perspective. process capability measures shortterm ability of a process to meet specs. process perfor-mance measures long term ability of a process to meetspecs. process Performance should be distinguished fromProcess Capability. Pp is similar in definition to Cp, andPpk is similar in definition to Cpk but in each we use theoverall standard deviation of the data, including anySpecial cause variation, rather than the short term estimateof standard deviation. The overall standard deviation is aweighted average of both within-group and between-group variation.
8 As a customer, one wants to measure per-formance based on total incoming variability. This is illus-trated in figure 2. Within subgroup Capability versus weighted average of boththe within and between spread (Performance).Cpm (Cp-Taguchi)The Cpmindex was introduced in 1988 (Chan6). Theprincipal difference between Cpm and Cpk is the relativeimportance of Conformance to Specs versus Run to measures how well the process mean is centeredwithin the spec limits, and what percentage of productwill be within spec. Instead of focusing on spec limitsCpm focuses on how well the process mean correspondsto the process target, which may or may not be midwaybetween the spec limits. Cpm is motivated by Taguchi s Loss Function . The denominator of Cpm includes theRoot Mean Square deviation from the USL LSL6 { 2+ (Xbar Tgt)2}1/2 Cpk is preferred to Cp because it measures bothprocess location and process standard deviation.
9 Cpm isoften preferred to Cpk because the variability term used inthe index is more consistent with Run to ratio(Cr)12, 13is the inverse of Cp. If Cp = or more is considered a capable process , then a or less is desired for 6 USL LSL Tz Target Zis a measure of targeting and is similar to, butsimpler to estimate than (Xbar Target) Values of Tz between and are considered from page 1618 ASQ STATISTICS DIVISION NEWSLETTER, VOL. 18, NO. 1 Continued on page 19 mini -PAPERC ontinued from page 17%OOLP ercent Outside of Limituses the z-statistics to esti-mate the porportion of a population that lies beyond thespec limits. This measure assumes a Normal a two-sided specification, the ZLowerand ZUpperpropor-tions are calcuated from the process measn, standard devi-ation, and spec Xbar LSL ZUpper= USL Xbar Then look up the proportions from any Z-table.
10 One-sidedor nonsymmetrical specifications usually correspond toheavily skewed distributions and can yield exaggerated%OOL Per Million(defective) is similar to %OOL. Onemultiplies the ZLand ZUproportions by 1,000,000 each,then sum together. Again, these are theoretical estimatesbased on the assumption of a normal distribution. Table 2illustrates the relation between Cpk and PPM. If receivinginspection is performed, then it is possible to comparePPM-Observed (from receiving inspection) and PPM-Calculated (from the Normal Distribution).Table 2 PPM and Cpk fraction non-conforming ( ) , , , PPB*Note: This comparison of Cpk and PPM does notinclude the shift included in the Motorola SixSigma , GPpkTraditional Cpk can only be estimated from a stableprocess; , no Special Causes.