Transcription of Mixed Models for Repeated Measures - University of …
1 Mixed Models FOR Repeated (LONGITUDINAL) DATA DAVID C. HOWELL 5/15/2008 When we have a design in which we have both random and fixed variables, we have what is often called a Mixed model. Mixed Models have begun to play an important role in statistical analysis and offer many advantages over more traditional analyses. At the same time they are more complex and the syntax for software analysis is not always easy to set up. My original plan was to put together a document that looked at many different kinds of designs and the way to use them. However I have decided that I can accomplish many of my goals by restricting myself to the analysis of Repeated Measures designs. This is a place where such Models have important advantages. I will ignore the use of Mixed Models to handle nested factors (other than subjects) because that is an even more complicated system. A large portion of this document has benefited from Chapter 15 in Maxwell & Delaney (2004) Designing experiments and analyzing data.
2 They have one of the clearest discussions that I know. I am going a step beyond their example by including a between-groups factor as well as a within-subjects ( Repeated Measures ) factor. For now my purpose is to show the relationship between Mixed Models and the analysis of variance. The relationship is far from perfect, but it gives us a known place to start. More importantly, it allows us to see what we gain and what we lose by going to Mixed Models . In some ways I am going through the Maxwell & Delaney chapter backwards, because I am going to focus primarily on the use of the Repeated command in SAS Proc Mixed . I am doing that because it fits better with the transition from anova to Mixed Models . My motivation for this document came from a question asked by Rikard Wicksell at Karolinska University in Sweden. He had a randomized clinical trial with two treatment groups and measurements at pre, post, 3 months, and 6 months.
3 His problem is that some of his data were missing. He considered a wide range of possible solutions, including last trial carried forward, mean substitution, and listwise deletion. In some ways listwise deletion appealed most, but it would mean the loss of too much data. One of the nice things about Mixed Models is that we can use all of the data we have. If a score is missing, it is just missing. It has no effect on other scores from that same patient. Another advantage of Mixed Models is that we don t have to be consistent about time. For example, and it does not apply in this particular example, if one subject had a follow-up test at 4 months while another had their follow-up test at 6 months, we simply enter 4 (or 6) as the time of follow-up. We don t have to worry that they couldn t be tested at the same intervals. A third advantage of these Models is that we do not have to assume sphericity or compound symmetry in the model.
4 We can do so if we want, but we can also allow the model to select its own set of covariances or use covariance patterns that we supply. I will start by assuming sphericity because I want to show the parallels between the output from Mixed Models and the output from a standard Repeated Measures analysis of variance. I will then delete a few scores and show what effect that has on the analysis. Finally I will use Expectation Maximization (EM) to impute missing values and then feed the newly complete data back into a Repeated Measures anova to see how those results compare. The Data I have created data to have a number of characteristics. There are two groups a Control group and a Treatment group, measured at 4 times. These times are labeled as 0 (pretest), 1 (one month posttest) 3 (3 months follow-up) and 6 (6 months follow-up). I created the treatment group to show a sharp drop at post-test and then sustain that drop (with slight regression) at 3 and 6 months.
5 The Control group declines slowly over the 4 intervals but does not reach the low level of the Treatment group. There are noticeable individual differences in the Control group, and some subjects show a steeper slope than others. In the Treatment group there are individual differences in level but the slopes are not all that much different from one another. You might think of this as a study of depression, where the dependent variable is a depression score ( Beck Depression Inventory) and the treatment is drug versus no drug. If the drug worked about as well for all subjects the slopes would be comparable and negative across time. For the control group we would expect some subjects to get better on their own and some to stay depressed, which would lead to differences in slope for that group. These facts are important because when we get to the random coefficient Mixed model the individual differences will show up as variances in intercept, and any slope differences will show up as a significant variance in the slopes.
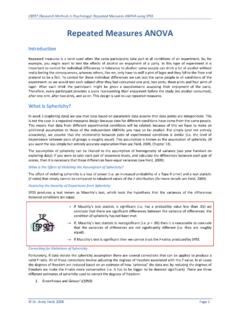
6 For the standard anova individual and for Mixed Models using the Repeated command the differences in level show up as a Subject effect and we assume that the slopes are comparable across subjects. Some of the printouts that follow were generated using SAS Proc Mixed , but I give the SPSS commands as well. (I also give syntas for R, but I warn you that running this problem under R, even if you have Pinheiro & Bates (2000) is very difficult. I only give these commands for one analysis, but they are relatively easy to modify for related analyses. The data follow. Notice that to set this up for anova (Proc GLM) we read in the data one subject at a time. (You can see this is the data shown.) This will become important because we will not do that for Mixed Models . Group Subj Time0 Time1 Time3 Time6 1 1 296 175 187 242 1 2 376 329 236 126 1 3 309 238 150 173 1 4 222 60 82 135 1 5 150 271 250 266 1 6 316 291 238 194 1 7 321 364 270 358 1 8 447 402 294 266 1 9 220 70 95 137 1 10 375 335 334 129 1 11 310 300 253 190 1 12 310 245 200 170 Group Subj Time0 Time1 Time3 Time6 2 13 282 186 225 134 2 14 317 31 85 120 2 15 362 104 144 114 2 16 338 132 91 77 2 17 263 94 141 142 2 18 138 38 16 95 2 19 329 62 62 6 2 20 292 139 104 184 2 21 275 94 135 137 2 22 150 48 20 85 2 23 319 68 67 12 2 24 300 138 114 174 A plot of the data follows: Time4321 Estimated Marginal Means300250200150100 TreatmentControlGroupEstimated Marginal Means of Dependent Variable The cell means and standard deviations follow.)
7 4. Group * TimeMeasure: ErrorLower BoundUpper Bound95% Confidence Interval Group means EstimatesMeasure: ErrorLower BoundUpper Bound95% Confidence Interval Grand Mean = The results of a standard Repeated Measures analysis of variance with no missing data and using SAS Proc GLM follow. You would obtain the same results using the SPSS Univariate procedure. proc GLM ; class group; model time1 time2 time3 time4 = group/ nouni; Repeated time 4 (0, 1, 3, 6) polynomial /summary printm; run; The GLM Procedure Repeated Measures Analysis of Variance Tests of Hypotheses for Between Subjects Effects Source DF Type III SS Mean Square F Value Pr > F group 1 Error 22 The GLM Procedure Repeated Measures Analysis of Variance Univariate Tests of Hypotheses for Within Subject Effects Source DF Type III SS Mean Square F Value Pr > F G - G H - F time 3 <.
8 0001 <.0001 <.0001 time*group 3 Error(time) 66 Greenhouse-Geisser Epsilon Huynh-Feldt Epsilon The GLM Procedure Repeated Measures Analysis of Variance Analysis of Variance of Contrast Variables Contrast Variable: time_1 The Linear Effect of Time (intervals = 0,1,2,3) Source DF Type III SS Mean Square F Value Pr > F Mean 1 <.0001 group 1 Error 22 Contrast Variable: time_2 The quadratic Effect of Time (intervals = 0,1,2,3) Source DF Type III SS Mean Square F Value Pr > F Mean 1 <.
9 0001 group 1 Error 22 Contrast Variable: time_3 Source DF Type III SS Mean Square F Value Pr > F Mean 1 <.0001 group 1 Error 22 Here we see that each of the effects in the overall analysis is significant. We don t care very much about the group effect because we expected both groups to start off equal at pre-test. What is important is the interaction, and it is significant at p = .0003. Clearly the drug treatment is having a differential effect on the two groups, which is what we wanted to see. The fact that the Control group seems to be dropping in the number of symptoms over time is to be expected and not exciting, although we could look at these simple effects if we wanted to.
10 We would just run two analyses, one on each group. I would not suggest pooling the variances to calculate F, though that would be possible. In the printout above I have included tests on linear, quadratic, and cubic trend that will be important later. However you have to read this differently than you might otherwise expect. The first test for the linear component shows an F of for mean and an F of for group. Any other software that I have used would replace mean with Time and group with Group Time. In other words we have a significant linear trend over time, but the linear group contrast is not significant. I don t know why they label them that way. (Well, I guess I do, but it s not the way that I would do it.) I should also note that my syntax specified the intervals for time, so that SAS is not assuming equally spaced intervals. The fact that the linear trend was not significant for the interaction means that both groups are showing about the same linear trend.