Transcription of Monte Carlo Simulation with HSPICE - iczhiku.com
1 Analog Integrated Circuits Design Fall 2007 1 Monte Carlo Simulation in HSPICE This short tutorial is intended to make the reader familiar with basic steps required for Monte Carlo Simulation in HSPICE . For this purpose, a sub-1V bandgap reference (BGR) voltage generator is chosen as a common case study. Assume the BGR circuit shown in Fig. 1 is the circuit we want to apply Monte Carlo analysis on it. Monte Carlo analysis is usually utilized to model random mismatch between different components due to process variation. In this particular case, as is obvious from Fig. 1, process variations may change the parameters of MOSFETs, BJTs and resistors. For accurate statistical Simulation , a certain model for each of these components in a particular processing technology should be formed by the manufacturing company.
2 These models include the distribution of different important technological parameters of each component, , for a MOSFET these parameters are Vth (threshold voltage variation), W (width variation), L (length variation), tox (oxide thickness variation), etc. Figure 1: Schematic of a simple sub-1 V bandgap reference voltage generator [Mok, JSSC 02]. In this tutorial, only the process variations of Vth and W (representing the whole variation, where = ) for MOS devices are considered [Pelgrom, JSSC, 1989], neglecting other variations. However, the interested reader may apply the same method to include the mismatch for other components as well, using the statistical models distributed by the manufacturers. Since each of these variations is originated from many other independent stochastic variables ( random walk of many carriers), these parameters would ideally have a Gaussian distribution.
3 Every Gaussian distribution is characterized by its mean value and the standard deviation ( ) from that mean. Design constraints would determine the mean value for a certain parameter, while is given by the manufacturer for a certain process technology. The actual values of standard deviations for important MOS parameters in an example 1P6M m CMOS technology are tabulated in Table 1. Analog Integrated Circuits Design Fall 2007 2 Table 1: Standard deviation of important MOS parameters in m CMOS technology NMOS PMOS Vth0 (mV) effeffLWM *effeffLWM * ( W/W) (%) effeffLWM *effeffLWM * * Note that Weff and Leff should be in m, and M is the multiplier coefficient representing the number of fingers or parallel devices. I) Simulation of width variation ( W/W) in MOS devices Using the values of Table 1, the width of MP1-MP3 in HSPICE netlist could be defined as.
4 Param wr1 = agauss(0, ' (m1*w1*l1)', 1) .param wr2 = agauss(0, ' (m2*w2*l2)', 1) .param wr3 = agauss(0, ' (m3*w3*l3)', 1) .param w1 = wm1*(1+wr1) .param w2 = wm2*(1+wr2) .param w3 = wm3*(1+wr3) Or .param w1 = gauss(wm1, ' (m1*w1*l1)', 1) .param w2 = gauss(wm2, ' (m2*w2*l2)', 1) .param w3 = gauss(wm3, ' (m3*w3*l3)', 1) where wm1, wm2 and wm3 are the mean widths of MP1, MP2 and MP3, respectively. Then the MOS devices would be defined as follows M1 vo1 outop vdd vdd pch W=w1 L=l1 m=m1 M2 vo2 outop vdd vdd pch W=w2 L=l2 m=m2 M3 vref outop vdd vdd pch W=w3 L=l3 m=m3 II) Simulation of threshold voltage variation ( Vth) in MOS devices The effect of Vth variation due to process variation can not be modeled easily in HSPICE since the actual relation of threshold voltage has become very complex for new accurate (for short-channel) MOS models such as BSIM3V3 (LEVEL=49 in SPICE).
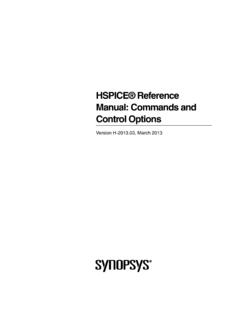
5 Hence, usually the variations of parameter Vth0 (refer to Table 1) which is the threshold voltage of long-channel devices with VBS=0 and small VDS is considered for modeling the mismatch due to process variations. However, as stated in Table 1, the definition of a Gaussian distribution for Vth0 depends on the exact dimensions of each MOS transistor. Due to some limitations in the definition of a processing technology library in HSPICE , such as 1P6M m CMOS technology which is utilized in our design, the value of Vth0 given by the manufacturer can not be modified. Hence, for modeling the impact of Vth variation in an MOS, a DC voltage source may be located in series with the gate terminal of the device which has a Gaussian distribution with zero mean value as shown in Fig. 2. So, using the standard deviation value of an NMOS in Table 1, M1 in Fig.
6 2 may be defined (in HSPICE ) as Analog Integrated Circuits Design Fall 2007 3 .param dvth1 = agauss(0,' (m1*w1*l1)',1) vmc1 vg vg_shift dvth1 M1 vd vg_shift vss vss nch W=w1 L=l1 m=m1 Figure 2: Modeling Vth variations using a DC voltage source with Gaussian distribution in series with the MOS gate terminal. III) Monte Carlo Simulation in HSPICE Now that the parameter variations of devices have been considered, the type of desired analysis should be set, such as operating point, DC sweep, AC sweep, or TRAN sweep. For example for transient analysis, .TRAN step stop_time SWEEP Monte =val The value val represents the number of Monte Carlo iterations to be performed. A reasonable number is 30 or higher. The statistical significance of 30 iterations is quite high.
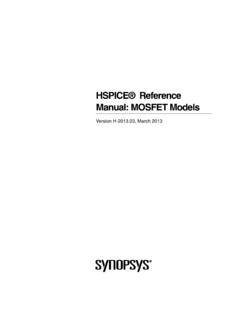
7 If the circuit operates correctly for all 30 iterations, there is a 99% probability that over 80% of all possible component values operate correctly. The relative error of a quantity determined through Monte Carlo analysis is proportional to val-1/2. Simulating this circuit using the above method, one may find the statistical metrics of any desired parameter of the circuit resulted from Monte Carlo analysis. This is usually done using .Measure statement. For our example the mean, variance, and standard deviation of the generated output reference voltage would be listed in the output listing file using the card below .measure tran ref find v(vref) at steady_state_time where steady_state_time should be set to a time after the BGR transient is passed. It is beneficial to plot the results of Monte Carlo Simulation using Histogram or Scattering diagram as shown in Fig.
8 3. Analog Integrated Circuits Design Fall 2007 4 Figure 3: Histogram and Scatter plot of the generated output voltage of BGR using Monte Carlo analysis in HSPICE .