Transcription of Parametric Technology Corporation - brown.edu
1 Parametric Technology Corporation Pro/ENGINEER Wildfire Tolerance Analysis Extension Powered by CETOL Technology Reference Guide Copyright 2007 Parametric Technology Corporation . All Rights Reserved. User and training guides and related documentation from Parametric Technology Corporation and its subsidiary companies (collectively PTC ) is subject to the copyright laws of the United States and other countries and is provided under a license agreement that restricts copying, disclosure, and use of such documentation. PTC hereby grants to the licensed software user the right to make copies in printed form of this documentation if provided on software media, but only for internal/personal use and in accordance with the license agreement under which the applicable software is licensed.
2 Any copy made shall include the PTC copyright notice and any other proprietary notice provided by PTC. Training materials may not be copied without the express written consent of PTC. This documentation may not be disclosed, transferred, modified, or reduced to any form, including electronic media, or transmitted or made publicly available by any means without the prior written consent of PTC and no authorization is granted to make copies for such purposes. Information described herein is furnished for general information only, is subject to change without notice, and should not be construed as a warranty or commitment by PTC.
3 PTC assumes no responsibility or liability for any errors or inaccuracies that may appear in this document. The software described in this document is provided under written license agreement, contains valuable trade secrets and proprietary information, and is protected by the copyright laws of the United States and other countries. It may not be copied or distributed in any form or medium, disclosed to third parties, or used in any manner not provided for in the software licenses agreement except with written prior approval from PTC. UNAUTHORIZED USE OF SOFTWARE OR ITS DOCUMENTATION CAN RESULT IN CIVIL DAMAGES AND CRIMINAL PROSECUTION.
4 For Important Copyright, Trademark, Patent, and Licensing Information: For Windchill products, select About Windchill at the bottom of the product page. For InterComm products, on the Help main page, click the link for Copyright 2007. For other products, select Help > About on the main menu for the product. UNITED STATES GOVERNMENT RESTRICTED RIGHTS LEGEND This document and the software described herein are Commercial Computer Documentation and Software, pursuant to FAR (a)-(b) (OCT 95) or DFARS (a) and (a) (JUN 95), and are provided to the US Government under a limited commercial license only.
5 For procurements predating the above clauses, use, duplication, or disclosure by the Government is subject to the restrictions set forth in subparagraph (c)(1)(ii) of the Rights in Technical Data and Computer Software Clause at DFARS (OCT 88) or Commercial Computer Software-Restricted Rights at FAR (c)(1)-(2) (JUN 87), as applicable. 02202007 Parametric Technology Corporation , 140 Kendrick Street, Needham, MA 02494 USA Introduction Pro/ENGINEER Tolerance Analysis Extension powered by CETOL Technology is a tolerance analysis application that is integrated with Pro/ENGINEER Wildfire With Tolerance Analysis Extension, you can quickly perform 1-D tolerance stackup analysis that is associative to the Pro/ENGINEER part dimensions.
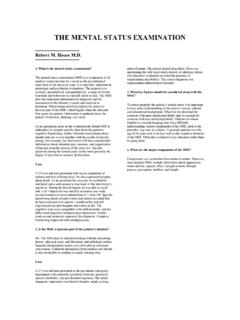
6 Background Tolerance Analysis Methods In performing a tolerance analysis, Tolerance Analysis Extension provides two fundamentally different analysis tools for predicting assembly measurement variation: worst-case analysis and statistical analysis. Worst-Case Tolerance Analysis Worst-case tolerance analysis is the traditional type of tolerance stackup calculation (Figure 1). The individual dimensions are set at their tolerance limits to make the stackup measurement as large or as small as possible. The worst-case model does not consider the statistical distribution of the individual dimensions, but rather that those dimensions do not exceed their respective specified tolerance limits.
7 Mathematically, the model assumes that all the tolerance dimensions will equal one of their limit values, which yields an extreme stackup condition. In other words, this model predicts the maximum expected variation of the measurement. Figure 1: Worst-case stackup variation Designing to worst-case tolerance requirements guarantees 100 percent of the parts will assemble and function properly, regardless of the actual component dimensional variation and stackup combination. The major drawback is that the worst-case model often requires very tight individual component tolerances.
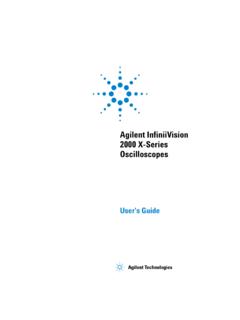
8 The obvious result is expensive manufacturing and inspection processes and/or high scrap rates. Worst-case tolerancing is often required for critical mechanical interfaces and spare part replacement interfaces. When worst-case tolerancing is not a contract requirement, properly applied statistical tolerancing can ensure acceptable assembly yields with increased component tolerances and lower fabrication costs. Statistical Variation Analysis The statistical variation analysis model takes advantage of the principles of statistics to relax the component tolerances without sacrificing quality.
9 Each component s variation is modeled as a statistical distribution (Figure 2) and these distributions are summed to predict the distribution of the assembly measurement. Thus, statistical variation analysis predicts a distribution that describes the assembly measurement variation, not the extreme values of that variation. This analysis model provides increased design flexibility by allowing the designer to design to any quality level, not just 100 percent. Figure 2: Statistical stackup variation Statistical Distributions Pro/ENGINEER Tolerance Analysis Extension powered by CETOL Technology represents all distributions in terms of scaled moments.
10 The moments used are mean, standard deviation, skewness, and kurtosis. Scaled moments are calculated from the central moments (moments about the mean) of the statistical distribution. Mean The distribution mean represents the average (or expected) value of the population. = distribution mean Standard Deviation Standard deviation ( ) is a measure of the spread of a distribution. It is the square root of the second central moment (variance): ()212 = where: 2 = second central moment, variance Skewness Skewness is a measure of the symmetry of a distribution. A skewness of 0 indicates a perfectly symmetric distribution.