Transcription of Permian Region December 2021
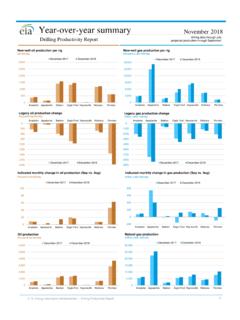
1 U. S. Energy Information Administration | Drilling Productivity Report05001,0001,5002,0002,5003,0003,500 2009201020112012201320142015201620172018 Oilproductionthousandbarrels/dayPermian Region075150225300 Nov3,632 Mbbl/dProductionfromnew wellsLegacyproductionchangeNetchangeDec3 ,695 Mbbl/dthousand barrels/dayPermian Region +299-236+63 Indicated change in oil production (Dec vs. Nov)0150300450600750 Nov12,162 MMcf/dProductionfromnew wellsLegacyproductionchangeNetchangeDec1 2,413 MMcf/dIndicated change in natural gas production (Dec vs. Nov)millioncubic feet/dayPermian Region +603-352+2510100200300400500600010 0200300400500600700800200920102011201220 1320142015201620172018new-well oil production per rigrig countNew-well oil production per rigbarrels/dayPermian RegionRig countrigs (250) (200) (150) (100) (50) 0200920102011201220132014201520162017201 8 Legacyoil production changethousand barrels/dayPermian Region (400) (350) (300) (250) (200) (150) (100) (50)
2 0200920102011201220132014201520162017201 8 Legacygas production changemillion cubic feet/dayPermian RegionPermian Region03,0006,0009,00012,00015,00018,000 21,0002009201020112012201320142015201620 172018 Permian RegionNatural gas productionmillioncubic feet/day010020030040050060008001,6002,40 03,2004,0004,800200920102011201220132014 2015201620172018new-well gas production per rigrig countNew-well gas productionper rigthousand cubic feet/dayPermian RegionRig countrigsdrilling data through October projected production through DecemberNovember 2018 Drilling Productivity ReportMonthlyadditions from one average rig Decemberbarrels/dayNovemberbarrels/daymo nthover monthOil+18 Gasthousandcubic feet/daymonth over month 0 Permian Regionmillion cubic feet/daymonthover month1,235 Decemberthousand cubic feet/dayNovember1.
3 235 613 595 thousandbarrels/daymonthover monthOil +63 Gas +2519
