Transcription of Practical Applications for Applying Six Sigma Using …
1 1 Copyright 2016 Peter Peterka Global Six Sigma USA LPPractical Applications for Applying Six Sigma Using Minitab2 Copyright 2016 Six Sigma & Minitab: Legibility of Success 2015 Book Applying Six Sigma Using Minitab Bruce Gilbert and Peter Peterka The Six Sigma process improvement methodology demonstrates the critical importance of properly Collecting and analyzing data. From its roots in manufacturing environment, the power of Six Sigma has Found its way into virtually all areas of business, government and nonprofit entities. Individuals and Organizations everywhere are recognizing that they can improve processes Using Six 2016 Peter Peterka, who I am, and why did I get into Statistical MethodsChemical Engineering 85Dr.
2 Deming MS in Statistics or Equivalent 87 ISU Statistics 893M 1999-2000 The Six Sigma Call 98 4 Copyright 2016 Global Six Sigma USA LP2001 Peter Peterkafounded the company Global Six Sigma USA LP (aka )TODAY:25 countries geography of the company s activity More than 5,000 companies became our clientsMore than 20,000 students5 Copyright 2016 Global Six Sigma USA LPCompany successfully implements Lean and Six Sigma in various industries: Agriculture Construction and Engineering Consulting Education Financial Services Governmental Services Healthcare and Hospitals HR Services Innovation and Technologies IT Systems and Technologies Logistics and Transportation Manufacturing Media Natural Resources Energy Non-Commercial Organizations/Foundations6 Copyright 2016 Global Six Sigma USA LPCompany is an approved provider for educational programs on Lean and Six Sigma by International Organizations IACET &PMI , so the students can earnPDU Registered Education Provider logo is a registered mark of the Project Management Institute.
3 2016 Global Six Sigma USA LP8 Copyright 2016 Support companies in solving problems with unknown solutions to achieve the breakthrough performanceOUR MISSION9 Copyright 2016 Practical Advice and Tips for Effectively Using Minitab How to introduce new users to Minitab including the best short 12 Bold FONT SIZE in Session in session window to copy one it by hand first, create the building blocks and use automatic PEN Windows 10 it four times, say it four times, be click throughs and screen images on t skip steps in beginning classes. Students want everything to match 100%10 Copyright 2016 How to Introduce New Users to Minitab Including The Best Short Cuts Ctrl D Ctrl M Ctrl E The all famous F3 If you don t know what to do then click okay Use courier new font for Minitab OutputDead Sea ScrollsShow WorkSheetsShow Graphs FolderInfoShow HistoryReportPad11 Copyright 2016 Click-Throughs and Images In order to visualize the relationship of the X (Predictor) to the Y (Response) variable use the Fitted Line Plot Open worksheet RegressStat > Regression > Fitted Line PlotShear Strength (psi)Age of Propellant (weeks)
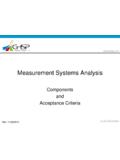
4 12 Copyright 2016 Multi-VariData Analysis Investigate the performance of process Ys looking for sources of variation with three basic analysis steps: 1. Practical Look at the raw data for abnormalities and errors 2. GRAPHICAL Plot the data to get a visual sense of the data Start with basic quality tools (from the first week) 3. ANALYTICAL SPC and basic statistical tools are often used Additional graphical and analytical tools will be covered throughout the remainder of this week13 Copyright 201621560555550545540 Roll of Brightness21560555550545540 Roll of BrightnessHint: try right mouse clicking and then selecting panel and choose 1 row and 4 : try right mouse clicking on box Add > Data Display > Individual to Enhance Minitab Graphs14 Copyright 2016 How to Enhance Minitab GraphsHint: XbarChart Options > Display > Check Box Display control limits at all stagesHint: Graph > Probability Plot > Distribution > Data Display > Uncheck Show Confidence.
5 15 Copyright 2016 Checking Stability, Shape, Spread and CenteringMinitab tools exercise: List all the Minitab toolsI-MR Control ChartNormality Test2 Variances orTest for Equal VarianceTwo Sample t-Test or One Way ANOVAC omparisons involving2 levels of the XStudy StabilityStudy ShapeStudy SpreadStudy CenteringMinitab roadmap -2 samples16 Copyright 2016 Organizing Graphs Layout Tool from Show Graphs Folder Layout Tool from Show Session 17 Copyright 2016 Sample Size Calculation vs Pareto Principle An Effect is average high minus average low Pareto vs. p-values Lenth stheory has problems Eyeball method is better18 Copyright 2016P-value Disease for Design of ExperimentsFactorial Regression: Yield versus Temp, Speed.
6 Type Analysis of VarianceSource DF AdjSS AdjMS F-Value P-ValueModel 7 * *Linear 3 * *Temp 1 * *Speed 1 * *Type 1 * *2-Way Interactions 3 * *Temp*Speed 1 * *Temp*Type 1 * *Speed*Type 1 * *3-Way Interactions 1 * *Temp*Speed*Type 1 * *Error 0 * *Total 7 2016 Vilfredo Pareto and the p-value in the Use of Factorial Experiments The 80/20 works No need for Minitab sample size calculator Use the eyeball method first to reduce Regression.
7 Yield versus Temp, Speed, Type Analysis of VarianceSource DF Adj SS Adj MS F-Value P-ValueModel 4 3 1 1 1 Interactions 1 *Type 1 3 7 2016 Ideas and suggestions for future improvements for Minitab Lean Minitab out Add by variable to normal plot DOE add cube plot to Factorial Plots, use Full Factorial by default21 Copyright 2016 Ideas and Suggestions for Future Improvements for Minitab Remember The power of Minitab in the information, graphic organization and not the statistical power Error proof it DOE order should be full factorial click-click if you don t know what to do click okay Be consistent some menus do the same function but different output Improve the menu system not just the assistant Not everyone is a statistician model regression way-way to complex button crazy Character graphs having meaning One Way Get the cost down.
8 Maybe a use by day or number of uses. Have training companies evaluate new versions to learn how effect training. Minitab is holding meetings how to confuse my students Easy share function by email Peter button color button interquartile range Shade the line of brushed data points22 Copyright 2016 Thank you!Peter 2016 Notes24 Copyright 2016 Notes