Transcription of Practical Rules for Using Color in Charts - …
1 Copyright 2008 Stephen Few, Perceptual EdgePage 1 of 13We can use Color in powerful ways to enhance the meaning and clarity of data displays, but only when we understand how it works, what it does well, and how to avoid problems that often arise when it s used improperly. My expertise in Color , which focuses almost exclusively on its proper use in data displays, is Practical in nature. My grasp of Color theory a fairly complex fi eld of study does not run deep. This article is intended for people like me who must understand Color insofar as it applies to quantitative data displays. We are concerned with the Practical use of Color , not its use for artistic expression. Becoming familiar with a few simple Rules about Color and its use will serve us in ContextLet s begin with an important fact about Color perception that must be understood to use Color effectively.
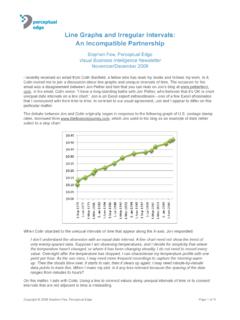
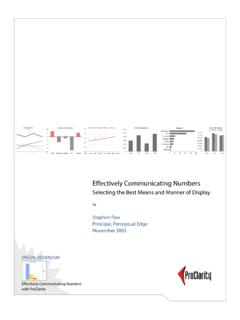
2 Like all aspects of visual perception, we do not perceive Color in an absolute manner. Our perception of an object is infl uenced by the context that surrounds it. In other words, although our eyes sense absolute wavelengths of light, which we call Color , we perceive an object s Color in contrast to the one or more colors that surround it. Visual perception is relative, not absolute. I ll illustrate this Using the small gray square below:I will now place four copies of this square at various locations in a large rectangle, which varies in Color from white on the left along a progressive gradient of gray until to reaches pure black on the right. Notice how different the small square looks at each , I am not playing tricks. I have done nothing to alter the Color of the small rectangle. We perceive them as different from one another, because each is immediately surrounded by Practical Rules for Using Color in ChartsStephen Few, Perceptual EdgeVisual Business Intelligence NewsletterFebruary 2008perceptualedgeCopyright 2008 Stephen Few, Perceptual EdgePage 2 of 13a different shade of gray.
3 When surrounded by light gray on the left, the small rectangle appears darker than it does when surrounded by dark gray on the right. So, what does this mean in Practical terms? Two Practical Rules emerge from this observation:Rule #1If you want different objects of the same Color in a table or graph to look the same, make sure that the background the Color that surrounds them is consistent. Rule #2If you want objects in a table or graph to be easily seen, use a background Color that contrasts suffi ciently with the straightforward application of the Rule #1 to graphs is to avoid Using gradients of Color in the background or varying the background Color in any other way. Don t give into the temptation to decorate a graph in a way that undermines its ability to present data #2 cautions us to choose colors carefully, always making sure that they are easy to see and that they effectively serve the purpose for which we are Using them.
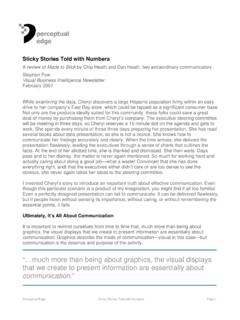
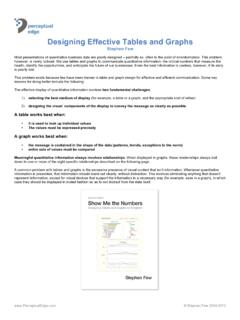
4 I ll illustrate this point Using a display that is becoming increasingly familiar, but is seldom done well. With Microsoft Excel and several other software products, you can display quantitative data in the form of a heatmap. A heatmap is a visual display that encodes quantitative values as Color . We are all familiar with weather maps, which use colors to represent varying amounts of rainfall or degrees of temperature. Heatmaps need not be arranged geographically; they can also be structured as a matrix of cells, such as a tabular arrangement of values in a spreadsheet. Here s a typical example of what I ve seen created with Excel:LaptopsDesktop PCsHarddisksFlash MemoryScreensKeyboardsPrintersScannersPD AsProjectorsCamerasCalifornia-2,2164,497 8843,2528,5643,4186,582-3,8912,3331,3565 ,450 Colorado3,41002,3382,6761,5673671,3613,2 498281,272-141 Connecticut00402,9981,21967300610989 Florida005837652,3059401,7372,72701,3444 97 Illinois009,3843,4054,3622,3314,4953,464 1,36601,569 Iowa37704126,5772104,4878721895,62203,46 6 Louisiana021,4551,5011,13809201,34900991 Massachusetts00-297012,489707000492367 Missouri001,224-1699863671,0111,125-210- 45-685 Nevada0875374884-4511,9344102104,497-10, 9784,355 New Hampshire1,0090-1660897376000882-43 New Mexico0-208-1613779020369-68300202 New York00-17,03408,5643,254003,4052,3267,58 9 Ohio82002,6714958272,305355-1342,7240705 Oklahoma02,7224924951,27402,305700-15,03 40571 Oregon-1393578187083954872,6718342,3102, 7271.
5 269 Texas01,3563,4158085,45202,3361,56700829 Utah1,1301,0061,5011,009678-1561,2229793 67-208904 Washington07684882,9981,6611,4521,418564 918-51,141 Wisconsin49701,4181,4505769167671,740201 ,337In this example, traffi c light colors of green, yellow and red are being used to encode high profi ts (green), low profi ts or losses (yellow), and high losses (red) across several product types and states. It is probably true that the values that are of greatest concern to the person viewing them are those in dark red and dark green, but they are the hardest values to read, because there is not enough contrast between black text and dark background colors for the numbers to stand out. I ll come back to heatmaps a bit later. For now, let s move on to other Rules for Using Color in data 2008 Stephen Few, Perceptual EdgePage 3 of 13 Use Color Meaningfully and with RestraintI have a friend, Maureen Stone, who is an expert in Color .
6 She was once kind enough to write a guest article for my newsletter to introduce basic Color theory and how it applied to data displays. Once, while chatting casually at a conference, she and I were bemoaning the fact that Color is often applied haphazardly to data displays, tragically undermining their value. Regarding Color , people tend to think that more and brighter is better. To illustrate the point that the opposite is true, Maureen mentioned that conferences dedicated to Color and its use for information displays, exhibit great restraint in their use of Color during presentations. For example, their PowerPoint slides tend to include grays far more often than you ll typically see elsewhere. These experts realize that Color should be used meaningfully, not arbitrarily or gratuitously. Here s our next rule:Rule #3 Use Color only when needed to serve a particular communication should only add Color to an information display to achieve something in particular something that serves the goal of communication.
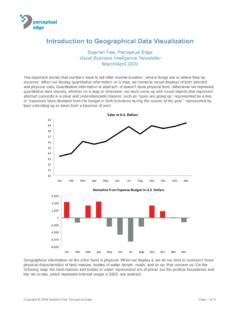
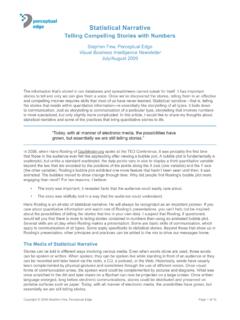
7 Don t use Color to decorate the display. Dressing up a graph might serve a purpose in advertising, but it only distracts people from what s important the data in an information #4 Use different colors only when they correspond to differences of meaning in the following graph illustrates one version of what we should avoid:0100,000200,000300,000400,000500,0 00600,000 ChinaRussiaFinlandSlovakiaRomaniaSaudi ArabiaEgyptWhat do the different bar colors in this graph mean? Not a thing. The labels along the X-axis tell us what the bars represent. The colors add no meaning or value, but their presence suggests that they do. Consciously or not, when people look at a data display and see visual differences, they try to determine the meaning to those differences. Suggesting meanings, which aren t there, wastes people s time, prompting them to expend mental resources in a fruitless pursuit.
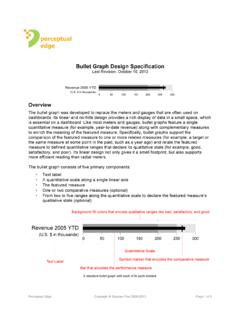
8 This graph is supposed to help people compare sales amounts associated with various countries. However, notice how much more your eyes are encouraged to compare the bars when they look alike, as shown on the following page, than when they look different, as shown 2008 Stephen Few, Perceptual EdgePage 4 of 130100,000200,000300,000400,000500,00060 0,000 ChinaRussiaFinlandSlovakiaRomaniaSaudi ArabiaEgyptWhenever you re tempted to add Color to a data display, ask yourself these questions: What purpose will this Color serve? and Will it serve this purpose effectively? If the answer is It serves no useful purpose or It serves a purpose, but something other than Color or this particular Color would do the job better, avoid Using ne Standard Palettes of Colors for Particular PurposesNature uses Color more wisely than most people do in tables and graphs.
9 In nature, what purpose do the bright colors of fl owers serve? They attract pollinators birds and bees to the fl owers so they ll spread the pollen and thereby propagate the species. This same strategy applies to data displays as well. When properly used, Color can powerfully draw attention to particular data. We can use Color effectively for three fundamental purposes in a data display to promote communication: To highlight particular data To group items To encode quantitative valuesWe re now ready for the next rule:Rule #5 Use soft, natural colors to display most information and bright and/or dark colors to highlight information that requires greater than taking time to select a Color from a huge list of possibilities each time we need one, time will be saved and the effectiveness of our choices will be improved by standardizing on a few good colors.
10 I recommend that you standardize on a few Color palettes, each designed for particular purposes. I maintain one palette of bright, dark colors, another of medium shades that are easy on the eyes, and a fi nal set of light, pale colors. The different levels of visual salience that these palettes represent serve particular purposes. Copyright 2008 Stephen Few, Perceptual EdgePage 5 of 13 Bright, dark colors are primarily useful for highlighting data in graphical displays, such as a particular set of bars, and they also come in handy for text. Colors are harder to see and tell apart when objects are small or thin, such as text, thin lines, and small data points. Notice in the two graphs below, that medium shades of Color , which work well for bars, are harder to see and distinguish when used for small data points.$0$100,000$200,000$300,000$400,00 0$500,000$600,000$700,000$800,000$900,00 0Q1Q2Q3Q402,0004,0006,0008,00010,00012,0 000 10203040506070 When objects are small or thin, colors that we use to encode them must sometimes be brighter and/or darker than otherwise necessary.