Transcription of Display Platforms for Quantitative Information
1 Display Platforms for Quantitative Information Stephen Few, Perceptual Edge Visual Business Intelligence Newsletter October/November/December 2014. When we present Quantitative Information to others, we must first determine the most effective manner in which that Information can be conveyed. What will serve as the best platform of Display ? A dashboard? A static report? Something more interactive? In this article, I'm providing guidelines to help you make this decision. The ways in which we Display Quantitative data and the types of data interaction that we enable in those displays are largely determined by the ways in which the data will be used. Different uses require different Platforms of Display . By platform , I mean either 1) a software tool that supports particular forms of Display and functions for interacting with the data, 2) an Information Display that has been designed in a particularly way, or 3) both.
2 For example, a dashboard, as I define the term, is a visual Display people use to quickly and easily monitor what's going on. In this case, the dashboard ( Display platform ) is used for rapid monitoring (purpose). Based on my observations over several years, Quantitative data displays are typically used for the following purposes: Lookup: to find particular facts when they're needed Narrative: to communicate a particular set of related facts contained in a data set Monitoring: to rapidly update one's awareness of a situation Guided Data Analysis: to perform a specific analytical task using an application that is designed to do that in particular Exploratory Data Analysis (EDA): to explore and analyze a data set to find and understand useful Information , rather than attempting to answer a particular question Predictive Analysis: to determine probable outcomes related to particular conditions I classify the Display Platforms that support these uses as follows.
3 Lookup Report, for lookup Explanatory Report, for narrative Infographic, for narrative Live Presentation, for narrative Dashboard, for monitoring Analytical Application, for guided data analysis EDA Tool, for exploratory data analysis Predictive Model, for predictive analysis Each of these Display Platforms vary across the following set of characteristics: Interaction: The degree to which interactions with the data must be supported: 1) none, 2) links and tooltips only, 3) the addition of selection/filtering, 4) more, but limited, and 5) flexible and fluid Frequency of use: How often a particular individual would typically use the Display : 1) rarely, 2). occasionally, and 3) regularly Data update frequency: How often the data that appears in the Display is updated: 1) never, 2). seldom, 3) often, and 4) real time or near real time Copyright 2014 Stephen Few, Perceptual Edge Page 1 of 7. Urgency of response: How quickly a person using the Display might typically need to respond to something that appears in it: 1) low ( , anytime from soon to later) and 2) high ( , without delay).
4 Analytical sophistication of the audience/users: The level of analytical expertise possessed by those who use the Display : 1) low, 2) mid, and 3) high Medium of Display : The medium that is used to present the Display : 1) paper, 2) large screen ( , on a projection screen for an audience to view), 3) desktop/laptop, 4) tablet, and 5) smartphone These profiles will help us understand the nature of the Display Platforms and will also help us choose between Platforms when more than one can serve a particular use case ( , in the case of narrative). Display Platforms This collection of Display Platforms that I'm proposing is not comprehensive, but it includes those that are typically useful today. Also, these Platforms are not perfectly distinct from one another. There are times when hybrid or even new approaches might be necessary. And finally, these Platforms are not the only possible way to classify the approaches that are available for Quantitative data sensemaking and communication.
5 Other taxonomies are certainly possible and potentially useful. Treat this content as a set of flexible guidelines and feel free to disagree with them. What matters most is that, before displaying data, we think about the ways that it will be used. Choosing an appropriate platform should be thoughtful, never arbitrary. Let's consider the Platforms individually. Lookup Report Organizations routinely produce great reams of lookup reports. This is what most traditional business intelligence (BI) systems have been churning out for years. They consist mostly of tabular reports Information arranged in columns and rows, with Quantitative values expressed textually as numbers. Typically, Information is segregated into logical groups and ordered either alphabetically or chronologically. As the name suggests, people use these reports to look up particular facts as they're needed. When designed properly, the arrangement of Information makes is easy to efficiently find the particular fact that's needed.
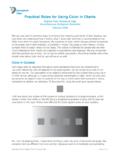
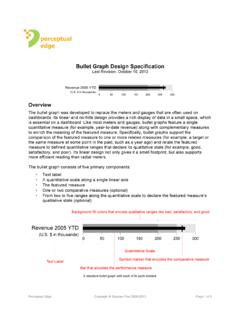
6 Lookup reports may be printed on paper or displayed online. When displayed online, additional means to lookup particular facts may be provided in the form of search, selection, and filter controls. Lookup reports are typically characterized as follows (highlighted in red): Use: Lookup platform : Lookup Report Characteristics Interaction None Links & Tooltips Only Plus Selection/Filtering More, but Limited Flexible & Fluid Frequency of Use Rarely Occasionally Regularly Data Update Frequency Never Seldom Often Real Time Urgency of Response Low High Analytical Sophistication Low Mid High of Audience/Users Display Medium Paper Large Screen Desktop/Laptop Tablet Smartphone It's worth noting that lookup reports typically require no interaction other than what's needed to find particular facts. Copyright 2014 Stephen Few, Perceptual Edge Page 2 of 7. Explanatory Report As I'm using the terms, explanatory reports and infographics are similar.
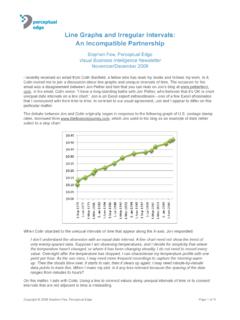
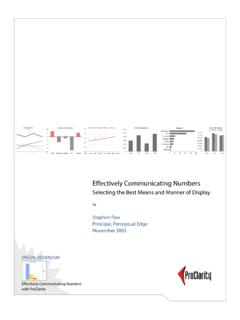
7 They are both used to communicate a particular set of facts to an audience. This is often called storytelling today, but the content doesn't necessarily need to be expressed in the strict form of a story. Explanatory reports differ from infographics in that they don't necessarily need to include graphics and people are usually willing to take some time viewing them, not necessarily expecting to assimilate the Information quickly. An organization's annual report is an example of an explanatory report. Explanatory reports are typically characterized as follows: Use: Narrative platform : Explanatory Report Characteristics Interaction None Links & Tooltips Only Plus Selection/Filtering More, but Limited Flexible & Fluid Frequency of Use Rarely Occasionally Regularly Data Update Frequency Never Seldom Often Real Time Urgency of Response Low High Analytical Sophistication Low Mid High of Audience/Users Display Medium Paper Large Screen Desktop/Laptop Tablet Smartphone Worth noting is the fact that explanatory reports do not require any interaction.
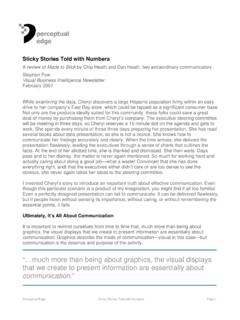
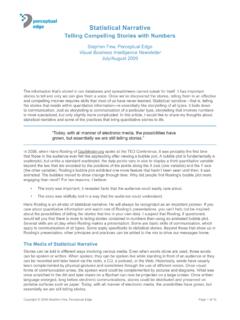
8 They contain all of the Information that the author wishes to communicate to a particular audience. Infographic An infographic combines words, numbers, and graphics, as needed, to communicate a particular message. When they're designed well, the specific medium of expression, whether words, numbers, or graphics, is always chosen because it communicates the content most effectively. Infographics are typically characterized as follows: Use: Narrative platform : Infographic Characteristics Interaction None Links & Tooltips Only Plus Selection/Filtering More, but Limited Flexible & Fluid Frequency of Use Rarely Occasionally Regularly Data Update Frequency Never Seldom Often Real Time Urgency of Response Low High Analytical Sophistication Low Mid High of Audience/Users Display Medium Paper Large Screen Desktop/Laptop Tablet Smartphone Copyright 2014 Stephen Few, Perceptual Edge Page 3 of 7. Usually, a person views an infographic only once to absorb its content and that content doesn't change.
9 There are exceptions, however, such as the Wind Map of the United States, designed by Martin Wattenberg and Fernanda Viegas, which someone might access regularly to view current wind patterns. Live Presentation The remaining Display platform for narrative content is a live presentation. When we present Quantitative Information to a group of people who are all simultaneously present in one location, we must Display it in a large format that everyone can see. We typically do this by projecting the content onto a large screen and designing the content as a sequential series of slides ( , PowerPoint or Keynote). A sequential series of content can also be presented using a data visualization tool that supports separate views that we can navigate by clicking tabs or a sequence of links. Live presentations are typically characterized as follows: Use: Narrative platform : Live Presentation Characteristics Interaction None Links & Tooltips Only Plus Selection/Filtering More, but Limited Flexible & Fluid Frequency of Use Rarely Occasionally Regularly Data Update Frequency Never Seldom Often Real Time Urgency of Response Low High Analytical Sophistication Low Mid High of Audience/Users Display Medium Paper Large Screen Desktop/Laptop Tablet Smartphone The primary factor that distinguishes a live presentation from other forms of narrative Display is the large screen.
10 Because people view the content from a distance, everything must be larger than usual, which limits the amount of content that can be shown on the screen at once. We usually sequence the content in a series of slides, in part, because it is difficult to show a great deal of Information simultaneously, which forces us to break it down into smaller chunks. Dashboard A dashboard, as I define it, is a Display that people use to rapidly monitor Information . Think of it as a Display that's used to maintain situation awareness. Anyone who must regularly update his or her awareness of the current state of things ( , a sales manager tracking daily sales activity or an operations manager tracking what's happening on the manufacturing floor in real time) can potentially benefit from a dashboard, much as an airline pilot benefits from her cockpit displays or a driver benefits from the Information that appears on his car dashboard.