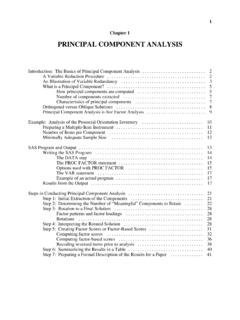
Transcription of Principal component analysis - University of Texas at Dallas
1 OverviewPrincipal component analysisHerv eAbdi1 and Lynne J. Williams2 Principal component analysis (PCA) is a multivariate technique that analyzes a datatable in which observations are described by several inter-correlated quantitativedependent variables. Its goal is to extract the important information from the table,to represent it as a set of new orthogonal variables called Principal components, andto display the pattern of similarity of the observations and of the variables as pointsin maps. The quality of the PCA model can be evaluated using cross-validationtechniques such as the bootstrap and the jackknife. PCA can be generalizedascorrespondence analysis (CA) in order to handle qualitative variables and asmultiple factor analysis (MFA) in order to handle heterogeneous sets of , PCA depends upon the eigen-decomposition of positive semi-definite matrices and upon the singular value decomposition (SVD) of rectangularmatrices.
2 2010 John Wiley & Sons, Comp Stat2010 2 433 459 Principal component analysis (PCA) is probably themost popular multivariate statistical techniqueand it is used by almost all scientific disciplines. Itis also likely to be the oldest multivariate fact, its origin can be traced back to Pearson1oreven Cauchy2[see Ref 3, p. 416], or Jordan4and alsoCayley, Silverster, and Hamilton, [see Refs 5,6, formore details] but its moderninstantiation was formal-ized by Hotelling7who also coined the described by several dependent vari-ables, which are, in general, inter-correlated. Its goalis to extract the important information from the datatable and to express this information as a set of neworthogonal variables calledprincipal also represents the pattern of similarity of theobservations and the variables by displaying them aspoints in maps [see Refs 8 10 for more details].
3 PREREQUISITE NOTIONS ANDNOTATIONSM atrices are denoted in upper case bold, vectors aredenoted in lower case bold, and elements are denotedin lower case italic. Matrices, vectors, and elements Correspondence to: of Behavioral and Brain Sciences, The University of Texasat Dallas , MS: , Richardson, TX 75080-3021, USA2 Department of Psychology, University of Toronto Scarborough,Ontario, CanadaDOI: the same matrix all use the same letter ( ,A,a,a). The transpose operation is denoted by data table to be analyzed by PCA comprisesIobservations described byJvariables and it isrepresented by theI JmatrixX,whosegenericelement isxi, rankLwhereL min{I,J}.In general, the data table will be preprocessedbefore the analysis . Almost always, the columns ofXwill be centered so that the mean of each columnis equal to 0 ( ,XT1=0,where0is aJby1vectorofzerosand1is anIby 1 vector ofones).
4 If in addition, each element ofXis dividedby I(or I 1), the analysis is referred to asacovariancePCA because, in this case, the matrixXTXis a covariance matrix. In addition to centering,when the variables are measured with different units,it is customary to standardize each variable to unitnorm. This is obtained by dividing each variable byits norm ( , the square root of the sum of all thesquared elements of this variable). In this case, theanalysis is referred to as acorrelationPCA because,then, the matrixXTXis a correlation matrix (moststatistical packages use correlation preprocessing as adefault).The matrixXhas the following singular valuedecomposition [SVD, see Refs 11 13 and Appendix Bfor an introduction to the SVD]:X=P!QT(1)wherePis theI Lmatrix of left singular vectors,Qis theJ Lmatrix of right singular vectors, and!Volume 2, July/August 2010 2010 John Wiley & Sons, the diagonal matrix of singular values.
5 Note that!2is equal to"which is the diagonal matrix of the(nonzero) eigenvalues of a columnis defined as the sum ofthe squared elements of this column and is computedas 2j=I ix2i,j.(2)The sum of all the 2jis denotedIand it is calledtheinertiaof the data table or thetotal the total inertia is also equal to the sum ofthe squared singular values of the data table (seeAppendix B).Thecenter of gravity of the rows[also calledcentroid or barycenter, see Ref 14], denotedg,isthevector of the means of each column , its center of gravity is equal to the 1 (Euclidean) distance of thei-th observationtogis equal tod2i,g=J j(xi,j gj)2.(3)When the data are centered Eq. 3 reduces tod2i,g=J jx2i,j.(4)Note that the sum of alld2i,gis equal toIwhich is theinertia of the data table .GOALS OF PCAThe goals of PCA are to(1)extract the most important information from thedata table;(2)compress the size of the data set by keeping onlythis important information;(3)simplify the description of the data set; and(4)analyze the structure of the observations and order to achieve these goals, PCA computesnew variables calledprincipal componentswhichare obtained as linear combinations of the originalvariables.
6 The first Principal component is requiredto have the largest possible variance ( , inertia andtherefore this component will explain or extract the largest part of the inertia of the data table).The second component is computed under theconstraint of being orthogonal to the first componentand to have the largest possible inertia. The othercomponents are computed likewise (see Appendix Afor proof). The values of these new variables forthe observations are calledfactor scores,andthesefactors scores can be interpreted geometrically as theprojectionsof the observations onto the the ComponentsIn PCA, the components are obtained from the SVDof the data ,withX=P!QT( 1), theI Lmatrix of factor scores, denotedF,isobtainedas:F=P!.(5)The matrixQgives the coefficients of the linearcombinations used to compute the factors matrix can also be interpreted as aprojectionmatrix because multiplyingXbyQgives the valuesof theprojectionsof the observations on the principalcomponents.
7 This can be shown by combining Eqs. 1and 5 as:F=P!=P!QTQ=XQ.(6)The components can also be representedgeometrically by the rotation of the original example, ifXrepresents two variables, the lengthof a word (Y)andthenumberoflinesofitsdictionarydef inition (W), such as the data shown in Table 1, thenPCA represents these data by two orthogonal geometric representation of PCA is shown inFigure 1. In this figure, we see that the factor scoresgive the length ( , distance to the origin) of theprojections of the observations on the procedure is further illustrated in Figure 2. Inthis context, the matrixQis interpreted as a matrixof direction cosines (becauseQis orthonormal). ThematrixQis also called aloadingmatrix. In thiscontext, the matrixXcan be interpreted as theproduct of the factors score matrix by the loadingmatrix as:X=FQTwithFTF=!2andQTQ=I.(7)This decomposition is often called thebilineardecomposition ofX[see, , Ref 15].
8 434 2010 John Wiley & Sons, 2, July/August 2010 WIREs Computational StatisticsPrincipal component analysisTABLE 1 Raw Scores, Deviations from the Mean, Coordinates, Squared Coordinates on the Components, Contributions of the Observations to the Components, Squared Distances to the Center ofGravity, and Squared Cosines of the Observations for the Example Length of Words (Y) and Number of Lines (W)YWywF1F2ctr1 100ctr2 100F21F22d2cos21 100cos22 100 Bag314 1 4 3 6 4 7 4 2 120160000010010039252444 1 2 IMW=8,MY= :w=(W MW);y=(Y MY).Thecontributionsandthesquaredcosines aremultipliedby100for ease of reading. Thepositiveimportant contributions are italicized , and thenegativeimportant contributions are represented in 2, July/August 2010 2010 John Wiley & Sons, New Observations onto theComponentsEquation 6 shows that matrixQis a projectionmatrix which transforms the original data matrixinto factor scores.
9 This matrix can also be used tocompute factor scores for observations that werenot included in the PCA. These observations arecalledsupplementaryorillustrativeobse rvations. Bycontrast, the observations actually used to computethe PCA are calledactiveobservations. The factorscores for supplementary observations are obtainedby first positioning these observations into the PCAspace and then projecting them onto the principalcomponents. Specifically a 1 Jrow vectorxTsup,canbe projected into the PCA space using Eq. 6. Thisgives the 1 Lvector of factor scores, denotedfTsup,which is computed as:fTsup=xTsupQ.(8)If the data table has been preprocessed ( , centeredor normalized), the same preprocessing should beapplied to the supplementary observationspriortothe computation of their factor an illustration, suppose that in addition tothe data presented in Table 1 we have the Frenchword sur (it means on ).
10 It hasYsur=3letters,andour French dictionary reports that its definition hasWsur=12 lines. Becausesuris not an English word,we do not want to include it in the analysis , butwe would like to know how it relates to the Englishvocabulary. So, we decided to treat this word as asupplementary first step is to preprocess this supplementaryobservation in a identical manner to the activeobservations. Because the data matrix was centered,the values of this observation are transformed intodeviations from the English center of gravity. We findthe following values:ysur=Ysur MY=3 6= 3andwsur=Wsur MW=12 8= we plot the supplementary word in the graphthat we have already used for the active the Principal components and the originalvariables are in the same space, the projections of thesupplementary observation give its coordinates ( ,factor scores) on the components.