Transcription of Printed on July 24, 2018 BlueBay Global Monthly …
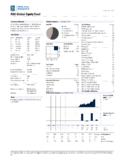
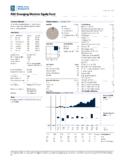
1 Printed on October 23, 2018 2018. Morningstar Research Inc. All Rights Reserved. The information contained herein: (1) is proprietary to Morningstar and/or its content providers; (2) may not be copied or distributed; and (3) is not warranted to be accurate, complete ortimely. Neither Morningstar nor its content providers are responsible for any damages or losses arising from any use of this information. Past performance is no guarantee of future results. These pages are not complete without the Global Monthly Income Bond FundInvestment ObjectiveTo provide as high a regular Monthly income as provide total returns comprised of interest income andmodest capital DetailsSeriesLoad StructureCurrencyFund CodeDNo LoadCADRBF1094 Inception DateJuly 2011 Total Fund Assets $Mil1, D NAV $ D MER % ICE BofAML GlblHY JPM EMBI JPM GBI-EMBroad Diversified ($US) Thomson ReutersConvertible Global FocusIndex (CAD Hedged)Income DistributionMonthlyCapital Gains DistributionAnnuallyMonthly Distribution ( /unit) Payout Rate (%)* *Assuming 12 consecutive months at the monthlydistribution set out above.
2 The estimate does not includeany year-end capital gains distributions paid in additionto the regular Monthly distribution nor should it beconfused with performance or rates of StatusOpenMin. Investment $500 Subsequent Investment $25 Fund CategoryHigh Yield Fixed IncomeManagement CompanyRBC Global AssetManagement Asset Global High Yield Emerging Markets Convertible BondsPortfolio Analysisas of September 30, 2018 Asset Mix% Income Breakdown% Fixed IncomeGovernment Backed Investments (Cash & Other) Backed Rating%Cash / Cash to Maturity%Under 1 - 5 - 10 10 Term tomaturity (Yrs) (Yrs) to Allocations% (ex-Emerging Markets) 25 Holdings% AssetsItaly (Republic Of) Treasury Nt Sanpaolo Treasury Notes (Republic Of) (Republic Of) 4% PLC Perf Matls Of South Africa Holding, Inc (Republic Of)
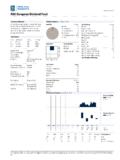
3 Holdings plc Suisse Group AG AMRO Bank Bank AG Generale - Bobl Future Mexican States Mexicanos Tesouro Nac 0% Acquisition Corp. Mexican States RABOBANK % of Top 25 Number of Stock Holdings26 Total Number of Bond Holdings378 Total Number of Other Holdings149 Total Number of Holdings553 Performance Analysis as of September 30, 20189101112131415 Growth of $10,000 Series D$12,810-50510152008 2009 2010 2011 Returns %Series DFundQuartile1 Mth3 Mth6 Mth1 Yr3 Yr5 Yr10 YrSince Return % Quartile44844544143130120446 No. of Funds in CategoryPrinted on October 23, 2018 2018. Morningstar Research Inc. All Rights Reserved. The information contained herein: (1) is proprietary to Morningstar and/or its content providers; (2) may not be copied or distributed; and (3) is not warranted to be accurate, complete ortimely.
4 Neither Morningstar nor its content providers are responsible for any damages or losses arising from any use of this information. Past performance is no guarantee of future results. These pages are not complete without the Global Monthly Income Bond FundManagement OverviewManager BiosJustin JewellBlueBay Asset Management LLPJ ustin is Co-Head of BlueBay 's Global Leveraged FinanceLong-Only Strategies and a senior portfolio managerwithin the Global Leveraged Finance Group. Justin joinedBlueBay in 2009, initially as Head of High Yield Trading,before moving into portfolio management at thebeginning of 2012. He has spent a large part of hiscareer at UBS where, most recently, he was Director ofHigh Yield and Distressed Trading in KreuzerBlueBay Asset Management LLPTom joined BlueBay in July 2002 and is Co-Head ofBlueBay's Global Leveraged Finance Long-OnlyStrategies based in the Stamford, Connecticut, to BlueBay , Tom spent three years at Deutsche Bankwithin the Leveraged Finance and Financial SponsorGroup, in New York and London, where he was ananalyst prior to being promoted to Associate in holds a BA (cum laude) from Middlebury College, de Monts de SavasseBlueBay Asset Management LLPP ierre-Henri joined BlueBay in 2014 and is SeniorPortfolio Manager within the Convertible BondsInvestment Team.
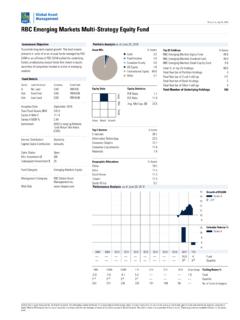
5 Pierre has been working in assetmanagement. He began managing convertible bonds in2005, first for Credit Suisse Asset Management and laterAberdeen Asset Management. He holds an MSc from cole Centrale de Lyon and a degree (DEA) in Models andMathematical Methods in Economics from Universit Paris I. He is also a CFA Analysis Cont'd as of September 30, 2018 Distributions ($)/UnitYTD*2017201620152014201320122011 201020092008 Total Dividends Capital Gains Return Of Capital EndedEndedEndedEnded12-20129-20149-2016 2-20162-20165-2018 Best/Worst Periods %1 Yr3 Yr5 Yr10 No. of Periods755127 Pct. * Distributions are characterized into income type at Commentary as at September 30, 2018 Market performance was mixed during the thirdquarter, with positive returns seen in July,volatility during August and some recovery inSeptember.
6 The high yield market had a positivequarter with strong corporate earnings drivingreturns, particularly in the US. Meanwhile, equitymarkets remained resilient, which provedsupportive for the convertible bond market overthe quarter. Emerging markets bonds deliveredmixed returns over the quarter, with hard currencyassets generating positive returns while localcurrency assets suffered. Over the quarter anallocation to local currency emerging market bondswas the primary driver of weak returns as manyemerging market currencies depreciated againstthe Canadian high yield sleeve was a strong contributor toperformance over the quarter. On a sector basis,holdings in energy and media were the topcontributors, while on a regional basis, exposureto North America was the top capital bond investments in Europeanbanks were also additive to performance.
7 Thefund s convertible investments also generatedpositive returns over the quarter with holdings inbasic industry, energy and healthcare sectorsbeing notable contributors. On the negative side,overall exposure to emerging markets detractedfrom returns while opportunistic positions inGreece and Italy also and policy uncertainty, along withemerging market concerns, may mean furthervolatility ahead but healthy Global growth,relatively low inflation and broadly accommodativepolicies should ultimately be supportive of on October 23, 2018 2018. Morningstar Research Inc. All Rights Reserved. The information contained herein: (1) is proprietary to Morningstar and/or its content providers; (2) may not be copied or distributed; and (3) is not warranted to be accurate, complete ortimely.
8 Neither Morningstar nor its content providers are responsible for any damages or losses arising from any use of this information. Past performance is no guarantee of future results. These pages are not complete without the Global Monthly Income Bond FundDisclosureRBC Funds, BlueBay Funds, PH&N Funds andRBC Corporate Class Funds are offered byRBC Global Asset Management Inc. anddistributed through authorized , trailing commissions,management fees and expenses all may beassociated with mutual fund read the prospectus or Fund Factsdocument before investing. Except asotherwise noted, the indicated rates of returnare the historical annual compounded totalreturns including changes in unit value andreinvestment of all distributions and do nottake into account sales, redemption,distribution or optional charges or incometaxes payable by any unitholder that wouldhave reduced returns.
9 Mutual funds are notguaranteed or covered by the CanadianDeposit Insurance Corporation or by any othergovernment deposit insurer. For moneymarket funds, there can be no assurancesthat the fund will be able to maintain its netasset value per unit at a constant amount orthat the full amount of your investment in thefund will be returned to you. The value ofmutual funds change frequently and pastperformance may not be document has been compiled by RBCG lobal Asset Management Inc. (RBC GAM)from sources believed to be reliable, but norepresentations or warranty, express orimplied, are made by RBC GAM, its affiliatesor any other person as to its accuracy,completeness or correctness. All opinionsand estimates constitute RBC GAM'sjudgment as of the date of this document, aresubject to change without notice and areprovided in good faith but without legalresponsibility.
10 The Top Ten/25 Holdings maychange due to ongoing portfolio transactionswithin the fund. The Prospectus and otherinformation about the underlying investmentfunds are available at (%) for RBC Funds, PH&N Funds andBlueBay Funds is based on actual expensesfor the half-year period, January 1 to June30, 2018, expressed on an annualized (%) for RBC Corporate Class Funds isbased on actual expenses for the full yearperiod, April 1, 2017 to March 31, H and Series I are not available forpurchase by new investors. Existinginvestors who hold Series H or Series I unitscan continue to make additional investmentsinto the same series of the funds they are only used to illustrate the effectsof the compound growth rate and do notreflect future values of any fund or returns oninvestment of any fund profile is provided for informationalpurposes only.