Transcription of Profile of Pell Grant Recipients - FinAid
1 Profile of pell Grant Recipients Quick Reference Guide Copyright 2011 by Fastweb LLC. All rights reserved. Visit for more tips on paying for college. Page 1 Family Income The average family adjusted gross income (AGI) for pell Grant Recipients is 123% of the poverty line (median 112%), compared with 395% of the poverty line for non- Recipients . pell Grant Recipient Status 2007-08 Adjusted Gross Income (AGI) Average Median Recipient $20,302 $15,223 Non-Recipient $69,235 $59,083 Two-thirds ( ) of pell Grant Recipients have family income at or below 150% of the poverty line, compared with one-sixth ( ) of non- Recipients . Almost all ( ) of pell Grant Recipients have family income at or below 250% of the poverty line, compared with a third ( ) of non- Recipients . This observation supports approaches to FAFSA simplification based on the poverty line, such as basing pell Grant eligibility on the same formula as income-based repayment or phasing out pell Grant eligibility from 150% to 250% of the poverty line.
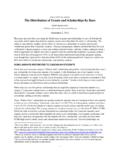
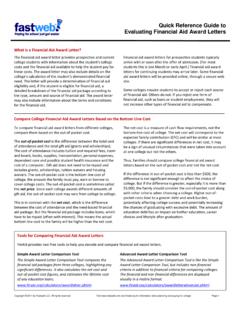
2 The parents of a quarter ( ) of pell Grant Recipients own a home or pay a mortgage, compared with half ( ) of the parents of non- Recipients . of the parents of pell Grant Recipients own investments, a business or farm worth more than $10,000, compared with of non- Recipients . This chart shows that graduation rates increase with increases in family income for students in Bachelor s degree programs. The next chart shows that students who receive larger pell grants are more likely to graduate after controlling for income. College Costs pell Grant Recipients tend to enroll more at colleges that are mid-range in cost. pell Grant Recipient Status 2007-08 Cost of Attendance < $10,000 $10,000 to $20,000 $20,000 or more Recipient Non-Recipient However, the distribution of pell Grant Recipients according to net price is similar to that of non- Recipients . pell Grant Recipient Status 2007-08 Cost of Attendance grants < $10,000 $10,000 to $20,000 $20,000 or more Recipient Non-Recipient This suggests that the pell grants are enabling choice in addition to access.
3 The pell Grant allows low-income students to enroll at more expensive colleges, such as 4-year public colleges instead of 2-year public colleges, with a positive impact on graduation rates. 0%10%20%30%40%50%60%70%80%90%100%6-Year Graduation Rates for Students in Bachelor's Degree Programs0%10%20%30%40%50%60%70%80%90%100 %< $10K$10K to $20K$20K to $30K$30K to $40K$40K to $50K6-Year Graduation Rates for Studentsin Bachelor's Degree ProgramsAll pell Grant RecipientsPell Grant $2,500 Profile of pell Grant Recipients Quick Reference Guide Copyright 2011 by Fastweb LLC. All rights reserved. Visit for more tips on paying for college. Page 2 Persistence Risk Index The risk index counts the number of key predictors of a student s failure to persist from the freshman to the sophomore year. The seven risk characteristics are: Delayed enrollment No high school diploma Part-time enrollment Financially independent Have dependents Single-parent status Working full-time while enrolled In the following table, low risk is defined as students with 0, 1 or 2 risk factors and high risk is defined as students with 3 or more risk factors.
4 pell Grant Recipients are more likely to be in the high risk group than non- Recipients . pell Grant Recipient Status 2007-08 Risk Index Low Risk High Risk Recipient Non-Recipient This has an impact on graduation rates. The next table shows 6-year graduation rates for pell Grant Recipients and non- Recipients among students in Bachelor s degree programs with family adjusted gross income capped at $50,000. pell Grant Recipient Status 2003-04 Graduation Rates by Risk Index Low Risk High Risk Recipient Non-Recipient Similar effects occur with the individual risk factors. For example, of students in Bachelor s degree programs who have a high school diploma graduate within 6 years, compared with of students who have only a GED or other equivalency. But a high school diploma has a smaller impact on graduation rates in Associate s degree or Certificate programs. Gender pell Grant Recipients are much more likely to be female than non- Recipients .
5 Part of the difference, but not all of it, is due to differences in FAFSA application rates according to gender. Slightly more than half of men ( ) file the FAFSA, compared with almost two-thirds of women ( ). pell Grant Recipient Status 2007-08 Gender Male Female Recipient Non-Recipient Female pell Grant Recipients in Bachelor s degree programs are also more likely to graduate in 6 years than male pell Grant Recipients in Bachelor s degree programs ( vs. , family AGI capped at $50,000). Dependency Status pell Grant Recipients are much more likely to be independent. pell Grant Recipient Status 2007-08 Dependency Status Dependent Independent Recipient Non-Recipient This difference is mostly due to single-parent independent students, who are more common among pell Grant Recipients . pell Grant Recipient Status 2007-08 Type of Independent Student No Dependents Dependents Unmarried Married Unmarried Married Recipient Non-Recipient pell Grant Recipients in Bachelor s degree programs who are dependent students are more likely to graduate in 6 years (family AGI capped at $50,000).
6 The graduation rate is for dependent students, compared with for independent students. The graduation rate is for students who are single parents, compared with for students who are not single parents. Student and Parent Marital Status The increased percentage of single-parent independent students is not entirely due to differences in marital status. of pell Grant Recipients are single or separated, compared with of non- Recipients . pell Grant Recipient Status 2007-08 Marital Status Single Married Separated Recipient Non-Recipient Profile of pell Grant Recipients Quick Reference Guide Copyright 2011 by Fastweb LLC. All rights reserved. Visit for more tips on paying for college. Page 3 The parents of of pell Grant Recipients are married, compared with of the parents of non- Recipients . Parent marital status has a significant impact on the 6-year graduation rates of pell Grant Recipients in Bachelor s degree programs.
7 The following graduation rates are for students with family AGI capped at $50,000. Parent Marital Status 2003-04 6-Year Graduation Rate Married/Remarried Divorced/Separated Single Widowed Race/Ethnicity pell Grant Recipients are more likely to be Black or Hispanic and less likely to be White. These statistics are consistent with the prevalence of each race among low-income families. pell Grant Recipient Status 2007-08 Race/Ethnicity White Black Hispanic Asian Recipient Non-Recipient There are differences in 6-year graduation rates by race for pell Grant Recipients in Bachelor s degree programs (family AGI capped at $50,000). More than half ( ) of White students graduate in 6 years, compared with two-fifths ( ) of Black students, two-fifths ( ) of Hispanic students and two-thirds ( ) of Asian students. The distribution of Black and Hispanic students is skewed toward lower AGI, which may partially explain the lower graduation rates of minority students.
8 English is the primary language spoken at home for of pell Grant Recipients compared with of non- Recipients . Age Groups and Delayed Enrollment pell Grant Recipients tend to be slightly older than non- Recipients , shifting about 8% of students from a traditional age of 15-23 to the 24-29 age group. pell Grant Recipient Status 2007-08 Age Groups 15-23 24-29 30+ Recipient Non-Recipient However, the average age is similar, with years for pell Grant Recipients and years for non- Recipients . This suggests that there may be more skew in the age distribution. The shift toward older students is also manifested in delays between secondary and postsecondary education. of pell Grant Recipients delayed enrollment in college by one or more years, compared with of non- Recipients . Perhaps some students are waiting until they reach age 24? Students who are 24 years old as of December 31 of the award year are automatically independent.
9 The age group has an impact on 6-year graduation rates for pell Grant Recipients in Bachelor s degree programs (family AGI capped at $50,000). Half ( ) of students age 15-19 as of 12/31/2003 graduated within 6 years, compared with less than a third ( ) of students age 20-23, a quarter ( ) of students age 24-29 and a fifth ( ) of students age 30+. Enrollment Status Almost three-quarters of pell Grant Recipients in all degree and certificate programs are enrolled full-time, compared with less than two-thirds of non- Recipients . Only of pell Grant Recipients are enrolled less than half-time. pell Grant Recipient Status 2007-08 Enrollment Status Full-Time Half-Time < Half-Time Recipient Non-Recipient Among students in Bachelor s degree programs, almost seven-eighths ( ) are enrolled full-time, one-sixth ( ) are enrolled half-time and are enrolled less than half-time. Almost a third of students who are enrolled on at least a half-time basis receive a pell Grant , compared with a much smaller percentage of students who are enrolled less than half-time.
10 % Receiving pell Grant 2007-08 Enrollment Status Full-Time Half-Time < Half-Time All Students Bachelor s Degree Associate s Degree Certificate pell Grant Recipients were required to be enrolled on at least a half-time basis prior to 1986. From 1986 to 1992 a student with less than half-time enrollment could obtain a pell Grant if they Profile of pell Grant Recipients Quick Reference Guide Copyright 2011 by Fastweb LLC. All rights reserved. Visit for more tips on paying for college. Page 4 had a zero EFC. From 1992 onward students with less than half-time enrollment were eligible for a pell Grant with proportional reduction, without any requirement for a zero EFC. Restoring the requirement that pell Grant Recipients be enrolled on at least a half-time basis would save at most of pell Grant funding, about $100 million per year.