Transcription of Reliability Analysis - Discovering Statistics
1 C8057 (Research Methods II): Reliability Analysis Dr. Andy Field Page 1 2/15/2006 Reliability Analysis Measures of Reliability Reliability : the fact that a scale should consistently reflect the construct it is measuring. One way to think of Reliability is that other things being equal, a person should get the same score on a questionnaire if they complete it at two different points in time (test-retest Reliability . Another way to look at Reliability is to say that two people who are the same in terms of the construct being measured, should get the same score. In statistical terms, the usual way to look at Reliability is based on the idea that individual items (or sets of items) should produce results consistent with the overall questionnaire. The simplest way to do this is in practice is to use split half Reliability . This method randomly splits the data set into two. A score for each participant is then calculated based on each half of the scale.)
2 If a scale is very reliable a person s score on one half of the scale should be the same (or similar) to their score on the other half: therefore, across several participants scores from the two halves of the questionnaire should correlate perfectly (well, very highly). The correlation between the two halves is the statistic computed in the split half method, with large correlations being a sign of Reliability . The problem with this method is that there are several ways in which a set of data can be split into two and so the results could be a product of the way in which the data were split. To overcome this problem, Cronbach (1951) came up with a measure that is loosely equivalent to splitting data in two in every possible way and computing the correlation coefficient for each split. The average of these values is equivalent to Cronbach s alpha, , which is the most common measure of scale Reliability (This is a convenient way to think of Cronbach s alpha but see Field, 2005, for a more technically correct explanation).
3 There are two versions of alpha: the normal and the standardized versions. The normal alpha is appropriate when items on a scale are summed to produce a single score for that scale (the standardized is not appropriate in these cases). The standardized alpha is useful though when items on a scale are standardized before being summed. Interpreting Cronbach s (some cautionary tales ..) You ll often see in books, journal articles, or be told by people that a value of is an acceptable value for Cronbach s alpha; values substantially lower indicate an unreliable scale. Kline (1999) notes that although the generally accepted value of is appropriate for cognitive tests such as intelligence tests, for ability tests a cut-off point of if more suitable. He goes onto say that when dealing with psychological constructs values below even can, realistically, be expected because of the diversity of the constructs being measured.
4 However, Cortina (1993) notes that such general guidelines need to be used with caution because the value of alpha depends on the number of items on the scale (see Field, 2005 for details). Alpha is also affected by reverse scored items. For example, in our SAQ from last week we had one item (question 3) that was phrased the opposite way around to all other items. The item was standard deviations excite me . Compare this to any other item and you ll see it requires the opposite response. For example, item 1 is Statistics make me cry . Now, if you don t like Statistics then you ll strongly agree with this statement and so will get a score of 5 on our scale. For item 3, if you hate Statistics then standard deviations are unlikely to excite you so you ll strongly disagree and get a score of 1 on the scale. These reverse phrased items are important for reducing response bias) participants will actually have to read the items in case they are phrased the other way around.
5 In Reliability Analysis these reverse scored items make a difference: in the extreme they can lead to a negative Cronbach s alpha! (see Field, 2005 for more detail). C8057 (Research Methods II): Reliability Analysis Dr. Andy Field Page 2 2/15/2006 Therefore, if you have reverse phrased items then you have to also reverse the way in which they re scored before you conduct Reliability Analysis . This is quite easy. To take our SAQ data, we have one item which is currently scored as 1 = strongly disagree, 2 = disagree, 3 = neither, 4 = agree, and 5 = strongly agree. This is fine for items phrased in such a way that agreement indicates Statistics anxiety, but for item 3 (standard deviations excite me), disagreement indicates Statistics anxiety. To reflect this numerically, we need to reverse the scale such that 1 = strongly agree, 2 = agree, 3 = neither, 4 = disagree, and 5 = strongly disagree. This way, an anxious person still gets 5 on this item (because they d strongly disagree with it).
6 To reverse the scoring find the maximum value of your response scale (in this case 5) and add one to it (so you get 6 in this case). Then for each person, you take this value and subtract from it the score they actually got. Therefore, someone who scored 5 originally now scores 6 5 = 1, and someone who scored 1 originally now gets 6 1 = 5. Someone in the middle of the scale with a score of 3, will still get 6 3 = 3! Obviously it would take a long time to do this for each person, but we can get SPSS to do it for us by using Transform (see your handout on Exploring data). 9 Load the data from last week. 9 Using what you know about the Compute command (use your handout on exploring data for help if you need to), reverse score question 3. Reliability Analysis on SPSS Let s test the Reliability of the SAQ using the data in Now, you should have reverse scored item 3 (see above). Remember also that I said we should conduct Reliability Analysis on any subscales individually.
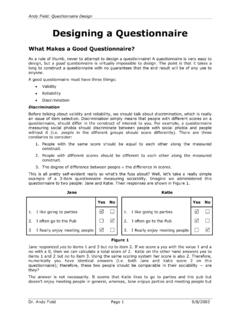
7 If we use the results from our orthogonal rotation (look back at your handout on Factor Analysis ), then we have 4 subscales: 1. Subscale 1 (Fear of computers): items 6, 7, 10, 13, 14, 15, 18 2. Subscale 2 (Fear of Statistics ): items 1, 3, 4, 5, 12, 14, 10, 21 3. Subscale 3 (Fear of mathematics): items 8, 11, 17 4. Subscale 4 (Peer evaluation): items 2, 9, 19, 22, 23 To conduct each Reliability Analysis on these data you need to follow the Analyze Scale Reliability Analysis .. menu path to display the dialog box in Figure 1. Select any items from the list that you want to analyze (to begin with let s do the items from the fear of computers subscale) on the left hand side of the dialog box and transfer them to the box labelled Items by clicking on . Figure 1 C8057 (Research Methods II): Reliability Analysis Dr. Andy Field Page 3 2/15/2006 selecting the List item labels checkbox will list all of the variable labels for each variable (which can be useful for checking to which items your variables relate).
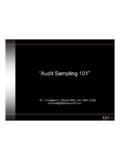
8 There are several Reliability analyses you can run, but the default option is Cronbach s alpha, which is the one we want. If you click on you can access the dialog box in Figure 2. In the Statistics dialog box you can select several things, but the one most important for questionnaire Reliability is: Scale if item deleted. This option provides a value of Cronbach s alpha for each item on your scale. It tells us what the value of alpha would be if that item were deleted. If our questionnaire is reliable then we would not expect any one item to greatly affect the overall Reliability . In other words, no item should cause a substantial decrease in alpha. If it does then we have serious cause for concern and you should consider dropping that item from the questionnaire. As is seen as a good value for alpha, we would hope that all values of alpha if item deleted should be around or higher. Use the simple set of options in Figure 2, to run a basic Reliability Analysis .
9 Click on to return to the main dialog box and then click to run the Analysis . Figure 2 Interpreting the Output SPSS Output 1 shows the results of this basic Reliability Analysis for the fear of computing subscale. The values in the column labelled Corrected Item-Total Correlation are the correlations between each item and the total score from the questionnaire. In a reliable scale all items should correlate with the total. So, we re looking for items that don t correlate with the overall score from the scale: if any of these values are less than about .3 (depends slightly on your sample size with bigger samples smaller correlation coefficients are acceptable) then we ve got problems because it means that a particular item does not correlate very well with the scale overall. Items with low correlations may have to be dropped. For these data, all data have item-total correlations above .3, which is encouraging. The values in the column labelled Alpha if Item is Deleted are the values of the overall alpha if that item isn t included in the calculation.
10 As such, they reflect the change in Cronbach s alpha that would be seen if a particular item were deleted. The overall alpha is .823, and so all values in this column should be around that same value. We re looking for values of alpha greater than the overall alpha because if the deletion of an item increases Cronbach s alpha then this means that the deletion of that item improves Reliability . None of the items here would substantially affect Reliability if they were deleted. The worst offender is question 10: deleting this question would increase the alpha from .823 to .824. Nevertheless this increase is not dramatic and both values reflect a reasonable degree of Reliability . C8057 (Research Methods II): Reliability Analysis Dr. Andy Field Page 4 2/15/2006 Finally, and perhaps most important, the value of Alpha at the very bottom is The Cronbach s alpha: the overall Reliability of the scale. To re-iterate we re looking for values in the magnitude of.