Example: confidence
SandP 500 ETF - The Vanguard Group
Ameasure of the volatility afund—based on fund’s last three years monthly returns—used to indicate dispersion past returns. higher standard deviation means greater potential for volatility. For funds with less than 36 months of performance history, standard deviation is …
Tags:
Information
Domain:
Source:
Link to this page:
Documents from same domain
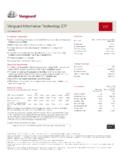
Vanguard Information Technology ETF VGT
institutional.vanguard.comVanguard Information Technology ETF As of June 30, 2018 Quickfacts Benchmark MSCI US Investable Market Information Technology 25/50 Transition Index
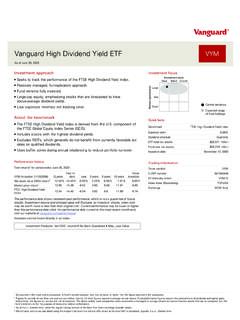
Vanguard High Dividend Yield ETF VYM
institutional.vanguard.comExpense ratio comparison1 ETFattributes High Dividend Yield ETF FTSE High Dividend Yield Index Number of stocks 408 405 Median market cap $107.6B $107.6B Price/earnings ratio 16.4x 16.4x
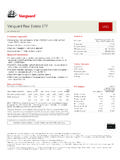
Vanguard Real Estate ETF VNQ
institutional.vanguard.comVanguard Real Estate ETF As of June 30, 2018 Quickfacts Benchmark MSCI US Investable Market Real Estate 25/50 Transition Index. Expenseratio1 0.12% Dividendschedule Quarterly
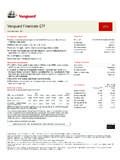
Vanguard Financials ETF VFH
institutional.vanguard.comVanguard Financials ETF As of June 30, 2018 Quickfacts Benchmark MSCI US IMI Financials 25/50 Index Expenseratio1 0.10% Dividendschedule Quarterly ETFtotalnetassets $7,973 million
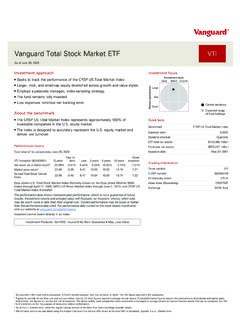
Vanguard Total Stock Market ETF VTI
institutional.vanguard.comExpense ratio comparison1 ETFattributes Total Stock Market ETF CRSP US Total Market Index Number of stocks 3,654 3,594 Median market cap $64.0B $64.0B Price/earnings ratio 20.8x 20.7x
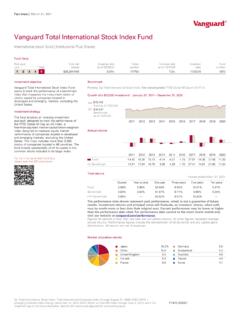
VanguardTotal International Stock Index Fund
institutional.vanguard.comFact sheet | December 31, 2018 VanguardTotal International Stock Index Fund International stock fund|Institutional Plus Shares Risk level Low High
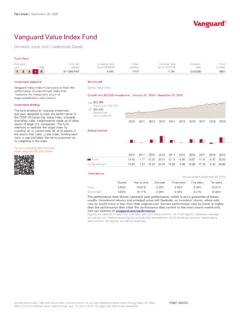
VanguardValue Index Fund
institutional.vanguard.comFact sheet | December 31, 2018 VanguardValue Index Fund Domestic stock fund|Institutional Shares ConnectwithVanguardfi>vanguard.com Plain talk about risk An investment in the fund could lose money over short or even long periods.
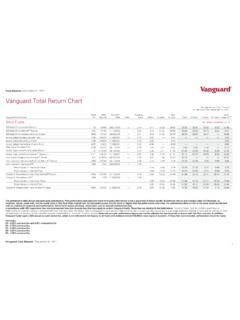
Total Return Chart MonthlyReturns - The Vanguard Group
institutional.vanguard.comThe performance data shown represent past performance. Past performance and especially short-term past performance is not a guarantee of future results. Investment returns and principal value will fluctuate, so investors’ shares, when sold, may be worth more or less than their original cost. Current performance may be lower or higher than the performance data cited. For …
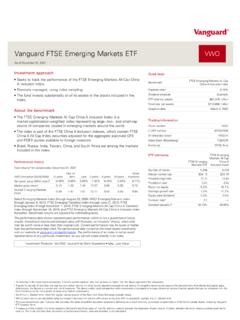
Vanguard FTSE Emerging Markets ETF VWO
institutional.vanguard.comVanguard ETF Shares in the secondary market and hold those shares in abrokerage account. In doing so, the investor may incur brokerage commissions and may pay more than net asset value when buying and receive less than net asset value when selling. All ETF products are subject to risk, which may result in the loss of principal.
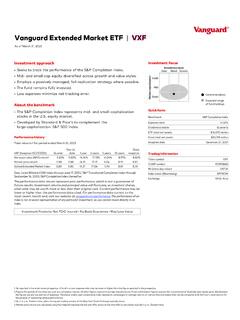
Vanguard Extended Market ETF VXF
institutional.vanguard.comVanguard ETF Shares in the secondary market and hold those shares in abrokerage account. In doing so, the investor may incur brokerage commissions and may pay more than net asset value when buying and receive less than net asset value when selling. All ETF products are subject to risk, which may result in the loss of principal.
Related documents
Guide to Performing Relative Quantitation of Gene ...
assets.thermofisher.comThe Relative Standard Curve Method a. Example of the Standard Curve Method: Using an Independent ... Standard Deviation Calculations Using the Standard Curve Method pg 52 3. The Comparative Ct Method (ΔΔC T Method) a. A Validation Experiment is Necessary to Determine if your ΔΔC T Calculation is Valid b. Plotting the Results of the ...
Appendix F: Guidelines for Standard Method Performance ...
www.eoma.aoac.orgStandard 5725-1-1994 (6). Table A4: Expected Precision (Repeatability) as a Function of Analyte Concentration. The precision of a method is the closeness of agreement between independent test results obtained under stipulated conditions. Precision is usually expressed in terms of imprecision and computed as a relative standard deviation

A Guide to Validation in HPLC - Weebly
parasshah.weebly.comexpressed as the relative standard deviation std dev x 100% %RSD = ────────── mean 2.2 Accuracy "Accuracy is a measure of the closeness of test results obtained by a method to the true value. " (6) Accuracy indicates the deviation between the mean value found and the true value. lt is
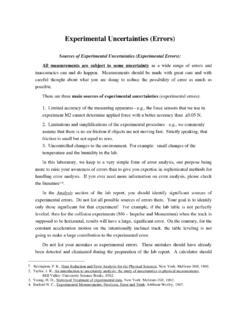
Experimental Uncertainties (Errors) - Purdue University
web.ics.purdue.eduThe standard deviation squared - ! s x 2 is the sum of squares of deviations from the average value divided by (n - 1). The subscript usually indicates the quantity that the standard deviation is calculated for, e.g., s v stands for the standard deviation of velocity measurements, whereas s a is the standard deviation for acceleration data.
Risk Classification (for All Practice Areas)
www.actuarialstandardsboard.orgMay 01, 2011 · Actuarial Standard of Practice No. 12 Risk Classification (for All Practice Areas) Revised Edition Developed by the Task Force to Revise ASOP No. 12 of the General Committee of the Actuarial Standards Board Adopted by the Actuarial Standards Board December 2005 Updated for Deviation Language Effective May 1, 2011 (Doc. No. 132)
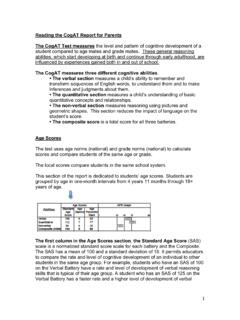
The CogAT Test Explanation for Parents
www.scusd.eduThe first column in the Age Scores section, the Standard Age Score (SAS) scale is a normalized standard score scale for each battery and the Composite. The SAS has a mean of 100 and a standard deviation of 16. It permits educators to compare the rate and level of cognitive development of an individual to other students in the same age group.