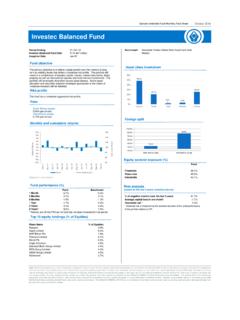
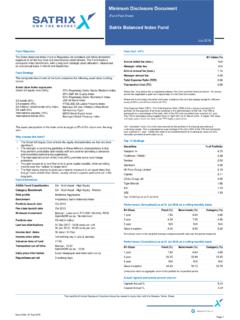
Transcription of Sanlam Select Flexible Equity Fund
1 Fees (Incl. VAT)LISP-class (%)Advice initial fee (max.)Neg.*Manager initial fee (max.) annual fee (max.)Neg.*Manager annual fee (max.) Expense Ratio (TER) is a Flexible asset allocation fund which is looking to deliver Equity like returns at lower risk levels. The fund aims to achieve maximum capital growth over the medium to long term. This fund is suitable for investors who can withstand potential capital volatility in the short ObjectiveThe fund will have a large exposure to Equity instruments and will look for companies where strong earnings growth is expected over the short to medium term, based on a top-down macro view. When investment ideas in the Equity market are limited the Manager will look to diversify across other asset classes to protect from potential market downturns.
2 The investment manager will also be allowed to invest in derivatives as allowed by the Act from time to time in order to achieve its investment Strategy The fund will consistently hold a large portion in Equity instruments, providing long term capital growth. This fund is less volatile than a pure Equity fund . The small Assets Under Management (AUM) of the manager means that the manager is very nimble and able to execute ideas quickly and react speedily to changes in market choose this fund ? fund InformationAdvice fee | Any advice fee is negotiable between the client and their financial advisor. An annual advice fee negotiated is paid via a repurchase of units from the a personalised cost estimate before investing by visiting and using our Effective Annual Cost (EAC) calculator.
3 Alternatively, contact us at 0860 100 fund is available via certain LISPS (Linked Investment Service Providers), which levy their own annual fee: (incl. VAT) | Maximum Performance Fees: (incl. VAT) and sharing rate: 20%. Performance fees will only be charged once the performance benchmark is outperformed, irrespective of whether the fund performance is positive or negative. If the fund performs in line or below the bench mark, then the minimum fee of (incl. VAT) is charged. The performance fee is accrued daily, based on daily performance and paid to the manager fund ClassificationSouth African Multi Asset FlexibleRisk ProfileAggressiveBenchmarkASISA South African Multi Asset Flexible Category AverageFee Class Launch date*01 September 2014 Portfolio Launch date01 April 2003 Minimum investmentLISP minimums applyPortfolio SizeR 1328 millionMonthly distribution30/11/2018: cents per unit31/10/2018: cents per unit30/09/2018: cents per unit31/08/2018: cents per unit31/07/2018: cents per unit30/06/2018: cents per unit31/05/2018: cents per unit30/04/2018: cents per unit31/03/2018: cents per unit28/02/2018: cents per unit31/01/2018: cents per unit31/12/2017: cents per unitIncome decl.
4 DatesMonthlyIncome price dates1st working dayPortfolio valuation time15:00 Transaction cut off time15:00 Daily price informationThe local newspaper and period3 working daysStd Deviation (Ann) Ratio (Ann) 10 Equity HoldingsPerformance (Annualised) as at 30 Nov 2018 on a rolling monthly basis*LISP-classFund (%)Benchmark (%)1 YearN/AN/ASince annualised rate of return is the average rate of return per year, measured over a period either longer or shorter than one year, such as a month, or two years, annualised for comparison with a one-year (Cumulative) as at 30 Nov 2018 on a rolling monthly basis*LISP-classFund (%)Benchmark (%)1 YearN/AN/ASince return is the aggregate return of the portfolio for a specified period.*Significant changes to this fund came into effect from 01 September 2014 and all performance figures are calculated from this date and not the original fund launch statistics: 3 years to 30 Nov 2018 Highest Annual % Annual % highest and lowest annual returns*TOTAL EXPENSE RATIOSPERIOD: 01 October 2015 to 30 September 2018 Total Expense Ratio (TER) | of the value of the Financial Product was incurred as expenses relating to the administration of the Financial Product.
5 A higher TER does not necessarily imply a poor return, nor does a low TER imply a good return. The current TER may not necessarily be an accurate indication of future TER s. Inclusive in the TER of , a performance fee of of the net asset value of the class of Financial Product was Cost (TC) | of the value of the Financial Product was incurred as costs relating to the buying and selling of the assets underlying the Financial Product. Transaction Costs are a necessary cost in administering the Financial Product and impacts Financial Product returns. It should not be considered in isolation as returns may be impacted by many other factors over time including market returns, the type of Financial Product, the investment decisions of the investment manager and the TER. Total Investment Charges (TER + TC) | of the value of the Financial Product was incurred as costs relating to the investment of the Financial 10% of Foschini Group Bank Group Group Group * Performance figures sourced from Morningstar.
6 * The highest and lowest 12 month returns are based on a 12 month rolling period over 10 yearsor since inception where the the performance history does not exist for 10 date: 19 December 2018 This monthly Minimum Disclosure Document should be viewed in conjunction with the Glossary of Terms Select Flexible Equity FundNovember 2018( fund Fact Sheet)After an October the market would like to forget, the result of Democrats wining the House at the US mid-term elections resulted in November getting off to a racing start. Unfortunately, the resumption of the trade war with China and an attack by Donald Trump on OPEC s high oil prices once again reignited global growth concerns, triggering a sell-off which ended with the All Share Total Return Index closing down after being up earlier in SummaryThe Sanlam Select Flexible Equity fund returned a negative in November, outperforming its benchmark ( ) in the period.
7 Key drivers of performance were Naspers, SA Retail and Banks as the market bounced off October lows despite a surprise 25 basis points (bps) rate hike by the South African Reserve Bank (SARB). Commodities sold off with global growth concerns mounting as US China trade war tensions seem to escalate. We have been trimming SA Inc. exposures into the recent rally with valuations appearing overextended given the current benign earnings growth environment in combination with higher interest rates. The largest Equity contributors to performance in November were:Naspers (NPN) Post Naspers maintaining its weighting in the MSCI it continued to rally into November bouncing off its 15-month lows. The next key catalyst will be the resolution to monetisation of newly launched games which we expect in mid-2019.
8 Despite this, Naspers continues to deliver attractive growth of 40% annually with an improving rump as its classifieds business turns positive. The Foschini Group (TFG) Foschini rallied in November shrugging off an interest rate hike which was untimely with the economy remaining under pressure. Foschini continued to deliver high single-digit growth with a stable outlook given its diversified retail offering. Capitec (CPI) South Africa s fastest growing bank rallied in November along with its peers as a stronger Rand and short-dated emerging market rally provided a tailwind for financials. We believe Capitec will likely deliver stable earnings growth between 17-23% as its credit card business gains traction, along with its newly launched insurance largest Equity detractors from performance in November were:British American Tobacco (BTI) The US Food and Drug Administration (FDA) s clampdown on nicotine levels continues to add pressure on BTI.
9 Furthermore, BTI is also being targeted by the FDA s toughening stance on e-cigarettes. This has resulted in BTI derating substantially as its future earnings growth comes into (SOL) Donald Trump s attack on OPEC resulted in oil prices falling from a peak of $85/bbl to below $60/bbl. Consequently, Sasol sold off aggressively. We do, however, believe that Sasol remains attractive on valuation and earnings and the recent sell-off provides a cheap entry point into sustainable growth once its US assets (LCCP) start ramping up from this quarter. Anglo American (AGL) Anglos sold off in line with commodities as global growth concerns re-emerged with the US China trade war reigniting in the month. A further concern is a China hard landing in Q1-2019 due to trade war concerns and front-loading of purchasing ahead of the second round of tariffs due in January 2019.
10 We believe that near-term weakness will abate shortly after Q1-2019 as commodity market deficit balances are priced in. Investment Manager Monthly CommentaryAsset AllocationAppointed Investment ManagerCapricorn fund Managers (Pty) LtdMarket view With all eyes focused on the G20 summit in Argentina, the investment world hopes for a resolution to the trade war between the US and China, which could provide a catalyst for growth ahead. This would provide a general market rally with commodities likely to outperform. With ORAMCO still stating their preference to list in 2021, we expect OPEC cuts to deepen resulting in Brent oil prices heading back towards $70/bbl. Locally, Cyril Ramaphosa faces a balancing act of trying to stimulate growth through investment while also facing fiscal constraints and a deepening debt to GDP.