Transcription of Sepic Converter Design and Operation
1 Sepic Converter Design and Operation Submitted 5/1/14 in partial completion of the requirements for a BS degree from WPI By Gregory Sharp Advisor: Alex Emanuel 1 Table of contents I) Abstract 2 II) Introduction 3 III) Topology 4 a) Operation 4 b) Specifications 6 c) Duty Cycle Calculations 6 d) Inductor Calculations 7 e) Simulation results 7 IV) Potentiometer Controlled PWM 10 a) PWM Demonstration 12 b) Circuit diagram 13 c) Simulation results 13 V) Feedback Controlled PWM 15 a) Feedback Flowchart 16 b) Feedback Results at Various Levels of Gain 16 VI) Summary 19 VII)
2 References 20 Table of Figures Fig Sepic Operation 4 Fig Sepic Simulation 5 Fig Graph of Vout and Pulse 5 Fig Graph of ICout, IL1 and Pulse 5 Fig Graph of Vout 8 Fig Graph of Pout and Pin 8 Fig Graph of Vout, D and VCin with Vin=10V 9 Fig Graph of Triangle wave and Sinusoidal control wave 12 Fig Graph of controlled square wave 12 Fig Labelled schematic of Sepic Converter using a potentiometer to control PWM. 13 Fig Graph of 555 and Triangle wave 13 Fig Graph of Comparator output to MOSFET, Triangle Wave and Potentiometer Control Signal 14 Fig Flow chart for feedback Operation 16 Fig Graph of Vout, as Vin increases.
3 Gain is almost zero 17 Fig Graph of Vout, as Vin increases. Gain is too low 17 Fig Graph of Vout, as Vin increases. Gain is too high 18 Fig Graph of Vout, as Vin increases. Gain is at a good value 18 2 I) Abstract The purpose of this project was to Design and optimize a Sepic dc/dc Converter ( single Ended Primary Inductance Converter ). The Sepic Converter allows a range of dc voltage to be adjusted to maintain a constant voltage output. This project talks about the importance of dc-dc converters and why Sepic converters are used instead of other dc-dc converters. This project also goes into detail about how to control the output of the Converter with either a potentiometer or feedback to show how it can be implemented in a circuit.
4 From this project, one learns dc-dc Converter optimization and control. 3 II) Introduction Circuits run best with a steady and specific input. Controlling the input to specific sub-circuits is crucial for fulfilling Design requirements. AC-AC conversion can be easily done with a transformer; however dc-dc conversion is not as simple. Diodes and voltage bridges are useful for reducing voltage by a set amount, but can be inefficient. Voltage regulators can be used to provide a reference voltage. Additionally, battery voltage decreases as batteries discharge which can cause many problems if there is no voltage control. The most efficient method of regulating voltage through a circuit is with a dc-dc Converter .
5 There are 5 main types of dc-dc converters. buck converters can only reduce voltage, boost converters can only increase voltage, and buck -boost, C k, and Sepic converters can increase or decrease the voltage. Some applications of converters only need to buck or boost the voltage and can simply use the corresponding converters. However, sometimes the desired output voltage will be in the range of input voltage. When this is the case, it is usually best to use a Converter that can decrease or increase the voltage. buck -boost converters can be cheaper because they only require a single inductor and a capacitor. However, these converters suffer from a high amount of input current ripple.
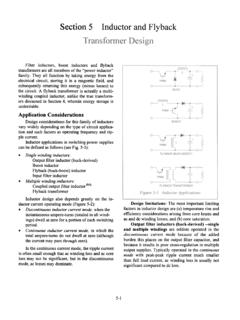
6 This ripple can create harmonics; in many applications these harmonics necessitate using a large capacitor or an LC filter. This often makes the buck -boost expensive or inefficient [2]. Another issue that can complicate the usage of buck -boost converters is the fact that they invert the voltage. C k converters solve both of these problems by using an extra capacitor and inductor. However, both C k and buck -boost Converter Operation cause large amounts of electrical stress on the components, this can result in device failure or overheating. Sepic converters solve both of these problems [2]. 4 III) Topology a) Operation : All dc-dc converters operate by rapidly turning on and off a MOSFET, generally with a high frequency pulse.
7 What the Converter does as a result of this is what makes the Sepic Converter superior. For the Sepic , when the pulse is high/the MOSFET is on, inductor 1 is charged by the input voltage and inductor 2 is charged by capacitor 1. The diode is off and the output is maintained by capacitor 2. When the pulse is low/the MOSFET is off, the inductors output through the diode to the load and the capacitors are charged. The greater the percentage of time (duty cycle) the pulse is low, the greater the output will be. This is because the longer the inductors charge, the greater their voltage will be. However, if the pulse lasts too long, the capacitors will not be able to charge and the Converter will fail as shown in Fig Fig Sepic Operation [4] 5 Fig Sepic Simulation Fig Graph of Vout and Pulse This graph shows the output ripple as a function of the input square wave.
8 Fig Graph of ICout, IL1 and Pulse This graph shows the ripple in the inductors and how the output capacitor charges and discharges based on the pulse. 6 b) Specifications: The Converter should meet certain standards 6V<Vin<18V Vout=10V Iout=1A Fsw=50 kHz An acceptable output current ripple is io, pp< A An acceptable output voltage ripple is Vo, pp< V c) Duty Cycle Calculation: The amount that the Sepic converters step up or down the voltage depends primarily on the Duty Cycle and the parasitic elements in the circuit. The output of an ideal Sepic Converter is However, this does not account for losses due to parasitic elements such as the diode drop VD.
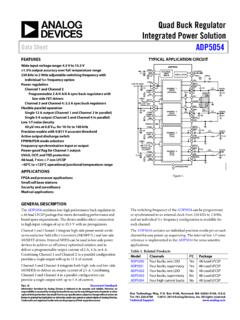
9 These make the equation: This becomes The maximum Duty Cycle will occur when the input voltage is at the minimum. If VD=.5V, the Duty Cycle is The minimum Duty cycle will occur when the input voltage is at the maximum. DVDVio 1*DVDVViDo 1*DoiDoVVVVVD VVVVVD7 d) Inductor Calculation: In theory, the larger the inductors are the better the circuit will operate and reduce the ripple. However, larger inductors are more expensive and have a larger internal resistance. This greater internal resistance will make the Converter less efficient. Creating the best Converter requires choosing inductors that are just large enough to keep the voltage and current ripple at an acceptable amount.
10 inductors with low internal resistance and around 150uH will be ideal for both of the inductors in the circuit. e) Simulation Results: Sepic WITH PARASITICS V 1 0 10 RL1 1 .07 L1 2 150u IC=0 S 2 0 20 0 SWK .MODEL SWK VSWITCH (RON=.2 ROFF=1 MEG VON=1 VOFF=0) VP 20 0 PULSE (0 10 0 1n 1n .01045m .02m) RCl 2 .08 C1 3 10u IC=0 L2 3 150u IC=0 RL2 0 .07 D 3 4 Dix .MODEL Dix D (RS= .07 BV=480 N=.01) C2 4 100u IC=0 RC2 0 .08 R 4 0 10 .PROBE .TRAN .005 .1 .099 10u UIC .END )50)(5(.)63)(.6()(maxmaxmin 8 Fig Graph of Vout Fig Graph of Pout and Pin This graph shows that the efficiency of the Converter =Pin/Pout= .91 9 Sepic AVERAGED MODEL WITH PARASITICS AND D INCREASING FROM 0 TO 1 VC 30 0 PWL (0, 0 100m, 1) D increasing from 0 to 1 V 1 0 10 L1 1 150u IC=0 RL1 1 2.