Transcription of Shock Severity Estimation - Sound and Vibration
1 Sound & Vibration /JANUARY 2012 The recently issued specification ANSI/ASA , Shock Test Requirements for Equipment in a Rugged Shock Environ-ment, specifies Shock Severity levels according to the plateau level on the PVSS plotted on 4CP or displayed as a 4CP, (pseudo-velocity Shock spectrum plotted on four coordinate paper or displayed as a four coordinate plot). The levels run from 1-10 meters per second or 40 to 400 ips. These ANSI levels provide an example of how to identify Shock Severity . Severity is the plateau level with the frequency range; , 210 ips from 8 to 200 Hz. Examples are plotted of both PVSSs and SRSs divided by 2pf, to form an ac-celeration PVSS or APVSS on 4CP. These show that the plateau of the APVSS is the same as the PVSS.
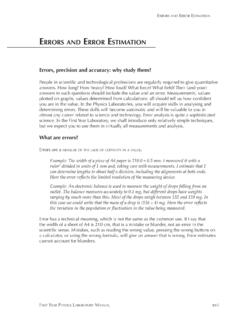
2 So published SRSs can be evaluated with constant velocity lines drawn on the SRS that also show the severe frequency range. The article shows Severity levels of many SRSs. Several pyroshock references that refer to plateau severities of 50 ips as very mild, 100 ips as moderate, and 300 ips as very severe are Shock is a violent transient motion delivered to the base of the equipment, and our concern is when it is severe enough to cause equipment failure. I ll say a Shock is a violent velocity change. The pseudo-velocity Shock spectrum (PVSS) of a simple Shock plotted on four-coordinate paper (4CP) looks like a flattened hill, as shown in Figure 1. The plateau or top of the hill shows the severe frequency range of the Shock .
3 The hill slopes down and to the right with an asymptote equal to the maximum accelera-tion. Maximum acceleration usually defines the high-frequency extent of the plateau. The hill slopes down and to the left with an asymptote equal to the maximum displacement, and maximum displacement defines the low frequency plateau limit. The height of the plateau of the PVSS on 4CP and its frequency range is the Severity of the Shock . The frequency range over which the plateau is at this high level is the range of equipment modal frequencies that can be excited to this velocity. Equipment and multi-degree-of-freedom systems (MDOFs) accept Shock energy only at their modal frequencies. The velocity induced in each MDOFs mode is equal to the PV at the modal frequency times the modal participation factor.
4 Peak modal velocity is proportional to peak modal stress. Thus peak modal stress is proportional to ,2,3 The plateau of the PVSS on 4CP is the severe Shock Definition and PrecedentsBecause we know the PVSS-4CP plateau is the severe Shock region, we can classify the Severity of a Shock by its plateau level and frequency range. I ll be saying the Severity of a Shock is, as an example, 200 ips from 15-450 Hz. My job here has three parts: Convince you that this is the right definition of Shock Severity Show how you can measure the plateau on existing SRS plots Show some example Severity estimations on published SRSsThe primary reason for defining the plateau level to be the Severity is that modal velocity is proportional stress.
5 Since maxi-mum stress limits Severity , it s natural that the velocity level that a Shock can deliverer to equipment is the Severity level. Stress is proportional to modal velocity: s =Krcn, where 1 K 10,4,5 or probably MDOF systems, both lumped and continuous, have modal responses given by the product of the participation factor and the modal PVSS ,2 In my training and course lectures,3 Shock analysis for beams results in the maximum modal velocity of each mode equal to a participation factor times the PVSS value at the modal frequency. Severe velocities that cause yield point stresses in mild steel beams turn out to be about 130 ips. So 100 ips becomes a common floor for Shock Severity . Appendix A contains a table of theoretically severe Shock modal velocities calculated from this theory.
6 It gives velocities of rods and beams that cause yield or fracture stress; they are shockingly low for many 2009, ANSI issued ANSI/ASA : Shock Test Re-quirements for Equipment in a Rugged Shock This specification defines 10 Severity levels in terms of velocity change at impact, Level 1 being a mild Shock of 1 m/s velocity change and Level 10 a very severe Shock of 10 m/s. Annex D defines the PVSS and links its plateau to the velocity change with its frequency limited by drop height and peak acceleration. Since 1 meter is ap-proximately 40 inches, a Level 2 Shock has a plateau velocity of 80 ips. The specification does not specify a low frequency, which I consider a deficiency. On a PVSS, the impact velocity change is the plateau level; the maximum acceleration and maximum displacement range define its frequency 45598 defines a Shock level in terms of the PVSS on 4CP with three numbers: d0, n0 and a0, which form the traditional flattened hill-shaped simple Shock PVSS on On May 18, 2008, NATO Standardized Agreement (STANAG) 4549: Testing of Surface Ship Equipment on Shock Testing Machines was adopted.
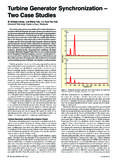
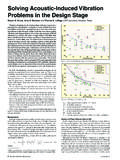
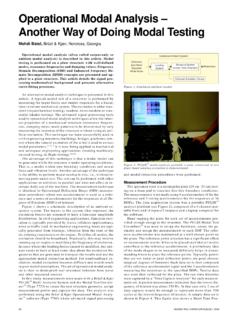
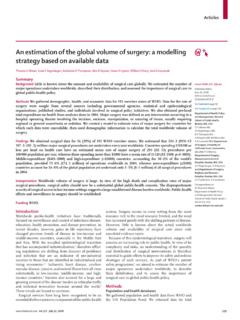
7 The NATO standardized level notation is defined to take the form: NS LEVEL (m, m/s, m/s2). With this, the Shock environment is completely defined in a compact data9 indicated PV to be the best Severity indicator. with a PV of 150 ips as the failure level for the six fans tested. Eubanks and Juskie10, and Gaberson and Eubanks11 defined equipment fragility as the highest PVSS on 4CP that the equipment is known to have commented on Shock Severity in terms of velocities, and Shock Severity EstimationHoward A. Gaberson, Oxnard, CaliforniaFigure 1. Five-percent damped PVSS on a four-coordinate display of the 1000-g, 200 ips, half-sine, drop-table Shock . Shock Severity is 185 ips from 2 to 400 2. Morse s chart labeling velocity on an SRS as a potential pyro- Shock damage indicator for electronic equipment.
8 45TH ANNIVERSARY ISSUE 13I ll quote his statement exactly. Specifically, experience suggests that structural damage to equipment is rare when the equipment is exposed to a Shock producing a peak modal velocity of less than m/sec (100 ) but is common when the peak modal velocity is more than 5 m/sec (200 ). I recently discovered Morse s chart13 and copied it here as Figure 2. It was presented at an Aerospace Corporation conference in 2000. He clearly shows that the aerospace community understood the significance of Shock spectrum velocities then, and I was told that the ideas were known in the early 1970s. Note that Morse is saying that 50 ips is a velocity below which failure seldom occurs, and 300 ips is a level of probable damage.
9 In summary, ample precedent and evidence supports the definition of Severity as the plateau level and frequency range of the PVSS on 4CP of the EquationsI hate to bore you, so skip down five equations if you already know Equations 2a, 2b, 2c, 2d. For those who aren t sure, I ll pres-ent the details. Four coordinate paper is sine wave paper. A sine wave with maximum value, zmax, and frequency as w, (w =2pf) in radians per second, and its two derivatives can be written as in Eqs. 1a, b, and c. (One dot over the z represents velocity and two dots, acceleration.) Considering the maximum absolute values, we can write Eq. 1d from 1b, and 1e from 1c: If we divide both sides of Eq. 1e by w, we get Eq. 1f, and if we compare Eq.
10 1f to 1d, we get Eq. 1g:Finally, if we eliminate w from Eq. 1g with 1d in 1h and simplify, we get Eq. 1i:The 4CP equations are Eqs. 1d, 1f, 1g, 1i. I ll write them as Eqs. 2a, b, c, d: Four-coordinate paper or a four coordinate plot, 4CP, is a no-mogram that shows these relations. At every point on the 4CP, these relations relate the four coordinates. If you know two of the coordinates at a point, the 4CP equations allow you to calculate the other two. The equations also hold on an SRS plot. I use Eq. 2c frequently to calculate velocity on an and Acceleration Pseudo-VelocityThe Shock response spectrum (SRS) has come to mean the maximum absolute acceleration of the mass of a base-excited, single-degree-of-freedom (SDOF) system exposed to the Shock .