Transcription of Signal-to-Noise Values in Empower 3 - Waters Corporation
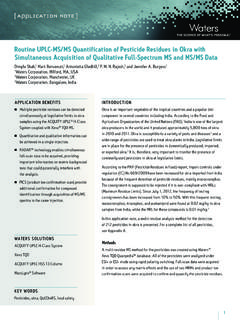
1 TECN134884650 Rev. 00 Page 1 of 18. Signal-to-Noise Values in Empower 3. This Technical Note describes how to calculate Signal-to-Noise (s/n) Ratio in Empower 3. There are four different methods that you can use to calculate the Signal-to-Noise ratio. Calculating Signal-to-Noise using noise from within the same chromatogram Calculating Signal-to-Noise using noise from a blank injection Calculating Signal-to-Noise in non-pharmaceutical or non-regulated environments Calculating Signal-to-Noise using a custom field Definition of terms Height Height is defined as measured from the apex of the peak to the baseline of the peak. Peak height is reported in microvolts ( V). Peak-to-peak noise Peak-to-Peak noise is the noise value that Empower uses to calculate EP, JP, or USP s/n. Peak to Peak noise is defined to be the algebraic difference of the maximum and minimum residuals between each data point and the least-square line.
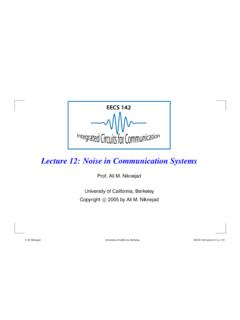
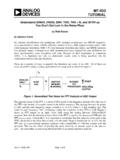
2 The residual is determined by subtracting the y value of the data point predicted by the line from the y value of the data point. The formula for Peak to Peak noise is: Peak to Peak noise = max residual min residual where: residual = (yi ypi). yi = Value of the data point ypi = Value of the data point predicted by the line Peak to Peak noise is expressed in detector units. For example, the peak to peak noise calculation for a UV detector would be expressed in absorbance units (AU). Average Peak to Peak noise is calculated by dividing the data into segments (specified in the processing method) and averaging the Values for each segment. In the example shown in Figure 1, the Peak to Peak noise is the sum of both maximum residual ( x10-6) and minimum residual ( x 10-7), which is x 10-6.
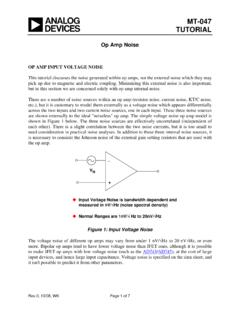
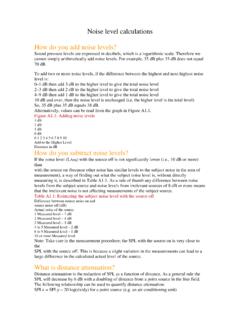
3 TECN134884650 Rev. 01 Page 2 of 18. Figure 1 Peak-to-peak noise determination Signal-to-Noise definition based on USP <621> Chromatography Chapter (reference USP. 38 NF 33, effective 5/1/2015 to 4/30/2016). S/N is calculated as follows: 2H. S/N =. h where: H = Height of the peak (Figure 2) measured from the peak apex to a baseline extrapolated over a distance 5 times the peak width at its half-height. h = Difference between the largest and smallest noise Values observed over a distance 5 times the width at the half-height of the peak and, if possible, situated equally around the peak of interest. Figure 2 USP Signal-to-Noise determination Signal-to-Noise Values in Empower 3. TECN134884650 Rev. 01 Page 3 of 18. Signal-to-Noise definition based on EP S/N is calculated as follows: 2H.
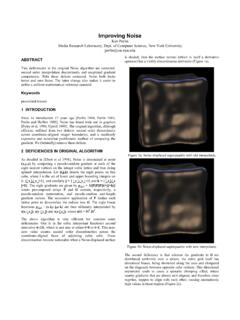
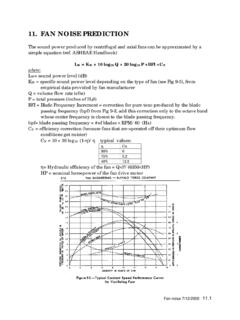
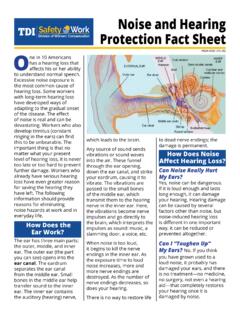
4 S/N =. h where: H = Height of the peak (Figure 3) corresponding to the component concerned, in the chromatogram obtained with the prescribed reference solution, measured from the maximum of the peak to the extrapolated baseline of the signal observed over a distance equal to at least 5 times the width at half-height. h = Range of the noise in a chromatogram obtained after injection or application of a blank, observed over a distance equal to at least 5 times the width at the half-height of the peak in the chromatogram obtained with the prescribed reference solution and, if possible, situated equally around the place where this peak would be found. Figure 3 EP Signal-to-Noise determination Difference of Height measured in Empower versus how USP or EP defines Height There is a difference in how Empower measures peak height as compared to how it is defined in the Pharmacopoeias (Figure 4).
5 Signal-to-Noise Values in Empower 3. TECN134884650 Rev. 01 Page 4 of 18. Figure 4 Height comparison between Empower and Pharmacopoeia Ht Pharmacopoeia Peak height from the peak apex to the middle of the noise as seen in the diagrams presented by the Pharmacopoeias (USP, EP, and JP). Ht Empower Height measured from the peak apex to the lowest signal point in the baseline and is reported in microvolts ( V). This is true for both ApexTrack and Traditional peak detection and integration. The difference between Ht Empower and Ht Pharmacopoeia is Peak to Peak noise . Due to this difference, Empower calculates signal to noise (USP s/n, EP s/n and JP s/n) based on the following formula. Empower S/N = 2 x (Height ( x noise / Scaling)) / ( noise / Scaling). where: Height = Empower field that is measured from peak apex to the lowest signal point in the baseline.
6 noise = Represented as the Empower peak fields USP noise , EP noise and JP noise if using a blank injection or the Empower result field Peak to Peak noise if calculated using a section of the same chromatogram. Scaling = Scale to V where it allows conversion of Plot units to Height ( V) units. In an example where you have a UV detector where the Plot Units is AU, the Scale to V is 1 x 10⁻⁶ Plot Units/ V. NOTES: 1. You must have the System Suitability option installed and enabled in the project for which you want to set suitability limits. 2. By default, the software reports the EP, JP, or USP s/n value to a precision of 6, not in scientific notation, and with no units. Signal-to-Noise Values in Empower 3. TECN134884650 Rev. 01 Page 5 of 18. Historical development of Empower s/n calculations When Empower 2 was released in May 2005, USP had not yet defined any s/n calculations.
7 With USP 31 NF 26 (effective May 1, 2008 - April 30, 2009), there was no s/n formula in the guidelines. However, beginning with USP 32 NF 27 (effective May 1, 2009 April 30, 2010), USP defined the s/n formula as 2H/n. Because of this update, Waters released Technical Note TECN10123052 Rev 00 in September 2009 that included suggested custom fields that you could use with or without a blank injection. In both occasions, noise was measured via the noise and Drift tab by specifying a fixed region of choice. With these custom fields, Empower 2 allowed height to be measured from the apex of the peak to the bottom of the noise in the baseline. In comparison, the built-in EP s/n value was calculated by subtracting half the noise to allow Height to be determined from the apex of the peak to the middle, rather than the bottom, of baseline noise .
8 Based on these calculations, there was a difference in the EP s/n by a value of 1 when you used the custom fields suggested in the Technical Note. With USP 34 NF 29 (effective date May 1, 2011 April 30, 2012), USP provided a better description of their formula by adding a diagram (Figure 2) together with the s/n formula. This clarified that the height measurement needed to be adjusted by half the noise , just as Waters had been doing in Empower 2 with the built-in EP s/n calculation. These changes were released in Empower 3 software when it was newly released in January 2011. In Empower 3, the built-in USP s/n field calculation accommodates not only the compensation of subtracting half the noise but also allows the half height multiplier to be effective in adjusting where to measure Peak-to-Peak noise on an identified blank injection.
9 If you do not use a blank injection, Empower 3 still uses noise and Drift with a fixed Start and Stop time as to where to measure Peak-to-Peak noise . Since Empower 3 was released, the built-in field has been used widely by our customers. Until the current release of USP 38 NF 33, and with upcoming release of USP 39 NF 34, the s/n formula has not been modified. In response to USP 35 chapter <621>, Chromatography, effective 01 December 2012, as well as changes to Chapter , Chromatographic Separation Techniques, of EP , the Empower 3 Signal-to-Noise calculation was modified effective with Empower 3 Feature Release 2 (FR2): USP s/n is still calculated as 2H/h, but the determination of H and h has been changed to match the EP and JP s/n calculations. The default width of the region used to calculate h (the half height multiplier) remains at 5.
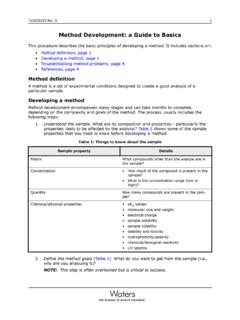
10 EP s/n is also still calculated as 2H/h, but the default width of the region used to calculate h (the half height multiplier) is now 5 instead of 20. Signal-to-Noise Values in Empower 3. TECN134884650 Rev. 01 Page 6 of 18. Calculating the Signal-to-Noise ratio Calculating the Signal-to-Noise ratio from within the same chromatogram You can calculate USP, EP, and JP Signal-to-Noise ratios using the same chromatogram without having to make blank injections in the same sample set or without the need to create a custom field. 1. In the Suitability tab of the processing method, select Calculate USP, EP, and JP s/n and then deselect Use noise centered on peak region in blank region (Figure 5). Figure 5 Processing Method Suitability tab, calculating s/n from the same chromatogram 2. Select the noise and Drift tab.