Transcription of STANLIB Aggressive Fund of Funds
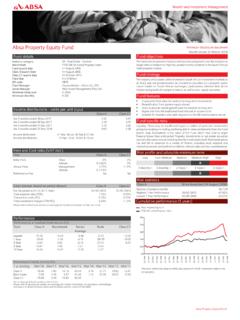
1 STANLIB Aggressive fund of Funds Factsheet / Minimum Disclosure Document as at 28 February 2018. investment Policy and Objectives Highlights The fund 's primary objective is to achieve higher than average capital growth over the longer term at . Managed by STANLIB 's highly talented Group Retail investment the risk of greater short-term volatility of capital values, with income generation as a secondary Team. objective. Annualised Performance (%)*. 1 year 3 years 5 years 10 years Since Inception Class B1 Cumulative Performance - Last 5 years Rank (Class B1) 8/61 34/57 27/46 28/34 - Sector - Class A Benchmark Lowest Return over 12 Rolling Months Highest Return over 12 Rolling Months *Annualized Return: is the weighted average compound growth rate over the performance period measured. The performance is calculated for the portfolio. The individual investor performance may differ as a result of initial fees, the actual investment date,the date or reinvestment and dividend withholding quoted are from Morningstar for the period ending 28.
2 February 2018 for a lump sum, using NAV-NAV prices and do not take any upfront manager's charge into account. Income distributions are declared on the ex-dividend date. Actual investment performance will differ based on the upfront manager's charge applicable, the actual investment date and the date of reinvestment of income. Asset Allocation (%). Top Sector Holdings(%). Portfolio Portfolio Facts Portfolio Size R million Sector Classification South African - Multi Asset - Flexible Income Distribution Income Distribution Net revenue is calculated daily and distributed bi-annually. Income Declaration 30 June & 31 December Paid in the last 12 Paid during 2017 payments as Benchmark FTSE/JSE All Share Index 85%; FTSE/JSE SA Listed Property Index months 2017 a % of year end (SAPY) 5%; BESA All Bond Index 5%; STeFI Composite Index 5%. price Class B1 cpu cpu %. Class B1 Class A Class A cpu cpu %. Launch Date 25 Jul 2005 25 Jul 2005. Top Holdings(% of fund ). Minimum investment Lump Sum R5,000 R5,000.
3 STANLIB SA Equity fund R Class Debit Order Per Month R500 R500 STANLIB Index fund R Class ISIN No. ZAE000070637 ZAE000068847 STANLIB Equity fund R Class JSE Code SAF1 STAA STANLIB Growth fund R Class Total Expense Ratio ** STANLIB ALSI 40 fund A Class Maximum Portfolio Charges STANLIB Institutional Property fund B1 Upfront Charge: Manager STANLIB Global Equity Feeder fund R Upfront Charge: Intermediary STANLIB Bond fund - Class R Total Service Charge STANLIB Global Property fund A Service Charge Intermediary Portion STANLIB Money Market fund Fees are quoted inclusive of VAT. Risk Rating ** Please refer to page 2 under Statutory Disclosure and General Terms & Conditions . Conservative Moderate Aggressive Please refer to page 2 for more details regarding this portfolio as well as other important information for consideration Factsheet ID : 92174. pg 1 of 3. STANLIB Aggressive fund of Funds Factsheet / Minimum Disclosure Document as at 28 February 2018. Franchise Portfolio Manager The five risk profiled fund of Funds range from Conservative to Aggressive and cater to provide an optimal investment solution.
4 The asset allocation between different asset classes is a key Paul Hansen determinant of investment performance and the Funds of Funds are actively managed in conjunction After completing articles at Alex Aiken and with STANLIB Asset Management. In keeping with the risk profiles selected by the client, the asset Carter, Paul joined UAL Merchant Bank in allocation will be strictly controlled within the ranges as shown on the opposite page. The process in 1979. He then worked in the US, mainly with which the Funds are managed reflects STANLIB 's Best investment View and the latest Shearson Lehman Bros and returning to SA. recommendations in the fund Focus document. Changes in global or local macro and micro in 1992, joined Old Mutual and then RMB. economic conditions, which might necessitate adjustments to the underlying fund composition, will Asset Management. He joined SCMB Asset be actioned immediately. Management in 1995. fund Features Quarterly Comments The following asset allocation is applied: Shares 75% to 95%, property Funds 0-20%, bond Funds 0- 10%, money market and income Funds 0-10% of the value of the fund .
5 The fund will not invest in fund Review participatory interests where the value of the foreign assets included in the fund exceeds 10% of its All three risk-oriented South African asset classes easily beat net asset values. Cash's + return in the third quarter of 2017 and again in the last quarter as the All Bond Index did + , the SA Listed Property Index did + and the All Share Index returned another highly impressive + In the twelve months to end December the All Share Index did best with + , surprising many after the weak performances of the past two-plus years, then Property with + , Bonds with + and finally Cash with + Banks and General Retailers sparkled in the last quarter, returning + and + respectively. The rand gained + against the dollar in the quarter, + against the pound and + against the euro. Your fund had an Risk excellent quarter and year. The Aggressive fund led with + in the quarter and + in the year, while even the Conservative General market risks include a decline in property values, share price volatility and a change in fund returned almost +3% in the quarter (double the STANLIB .)
6 Interest rates and economic conditions. Where foreign shares are included in the fund there may Income fund return) and + in the year. The Moderate fund be additional risks such as potential constraints on liquidity and the repatriation of Funds , came 1st out of 79 Funds in its sector in 2017, returning + , macroeconomic risks, political risks, tax risks, settlement risks and potential limitations on the while the Moderately Conservative fund came 1st out of 138. availability of market information. Funds in its sector, returning + in 2017. The Funds remain neutral relative to benchmark in local equities and listed property and are still underweight in bonds, ahead of a possible downgrade in March by Moodys. We remained very underweight offshore in the face of strengthening emerging market currencies. The STANLIB Index fund was our best performing major equity fund in the quarter with a return of + , followed by STANLIB 's SA Equity fund 's + We sold out of Statutory Disclosure and General terms & Conditions the Resources fund in November after it had gained +24% in 2017.
7 Overall it was a great quarter and year for all five fund of Collective investment Schemes in Securities (CIS) are generally medium to long term investments. The value of Funds . participatory interests may go down as well as up and past performance is not necessarily a guide to the future. An Looking Ahead investment in the participations of a CIS in securities is not the same as a deposit with a banking institution. CIS are The US stock market has continued to reach new record highs traded at ruling prices and can engage in borrowing and scrip lending. A schedule of fees and charges and early in 2018, while Europe, Japan and the Emerging Markets are maximum commissions is available on request from STANLIB Collective Investments (RF) (PTY)Ltd (the Manager). Commission and incentives may be paid and if so, would be included in the overall costs. Forward pricing is used. also gaining. The JSE is doing better too, although listed property Fluctuations or movements in exchange rates may cause the value of underlying international investments to go up has pulled back a bit.
8 We expect equity markets to deliver good or down. Liberty is a full member of the Association for Savings and Investments of South Africa. The Manager is a returns again in 2018. member of the Liberty Group of Companies. This portfolio is valued on a daily basis at 24h00. Investments and repurchases will receive the price of the same day if received prior to 15h00. The Total Expense Ratio (TER) of a portfolio is a measure of the portfolio's assets that were relinquished as operating costs expressed as a percentage of the daily average value of the portfolio calculated over a period of usually a financial year. Typical expenses which are deducted from a portfolio include service charges, taxes, trustee fees and audit fees. This portfolio is a fund of Funds that invests in portfolios of collective investment schemes that levy their own charges, which could result in a higher fee structure for the fund of Funds . The manager does not provide any guarantee either with respect to the capital or the return of a portfolio.
9 The manager has a right to close the portfolio to new investors in order to manage the portfolio more efficiently in accordance with its mandate. Additional information about this product, including brochures, application forms and annual or quarterly reports, can be obtained from the Manager, free of charge, and from the website: The prices of unit trust Funds are calculated and published on each working day. These prices are available on the Manager's website and in the South African printed news media. Contact Details STANLIB Collective Investments (RF)Pty Limited The Total Expense Ratio (TER) for this class or portfolio is indicated above, for the period from 10 Jan 2014 to 30. Reg. No. 1969/003468/07. Sep 2017. A higher TER ratio does not necessarily imply a poor return, nor does a low TER imply a good return. The 17 Melrose Boulevard PO Box 202. current TER cannot be regarded as an indication of future TERs. Melrose Arch Melrose Arch Johannesburg 2076.
10 South Africa Contact Centre 0860 123 003. Trustees : Standard Chartered Bank, 4 Sandown Valley Crescent, Sandton, 2196, Tel: 011 217 6600. Compliance No : HX2381. Published Date : 3/20/2018. pg 2 of 3. STANLIB Aggressive fund of Funds Factsheet / Minimum Disclosure Document as at 28 February 2018. Total Expense Ratio,Transaction Costs & Total investment Charge Total Expense Ratio (TER): This shows the charges, levies and fees relating to the management of the portfolio and is expressed as a percentage of the average net asset value of the portfolio, calculated over a rolling three years (where applicable) and annualised to the most recently completed quarter. A higher TER does not necessarily imply a poor return, nor does a low TER imply a good return. The current TER cannot be regarded as an indication of future TERs. Transaction Costs (TC): The percentage of the value of the fund as costs relating to the buying and selling of the fund 's underlying costs are a necessary cost in administering the fund and impacts fund returns.