Transcription of STANLIB Global Equity Fund
1 NOTE: Please refer to page 2 for more details regarding this Class Funds as well as other impor tant information for consideration. WW NO 37298 PAGE 1 OF 2 Portfolio FactsRisk ProfileIndustry BreakdownLargest HoldingsTotal Expense Ratio, Transaction Costs & Total Investment ChargeTotal Expense Ratio (TER): This shows the charges, levies and fees relating to the management of the por tfolio and is expressed as a percentage of the average net asset value of the por tfolio, calculated over a rolling three years (where applicable) and annualised to the most recently completed quarter. A higher TER does not necessarily imply a poor return, nor does a low TER imply a good return. The current TER cannot be regarded as an indication of future Costs (TC): The percentage of the value of the fund as costs relating to the buying and selling of the fund 's underlying assets. Transaction costs are a necessar y cost in administering the fund and impacts fund returns.
2 It should not be considered in isolation as returns may be impacted by many other factors over time including market returns, the type of fund , investment decisions of the investment manager and the Investment Charges (TIC): The percentage of the value of the fund incurred as costs, relating to the investment of the fund . As fund returns are reported after deducting all fees and expenses, these costs (the TER & TC) should not be deducted from the fund returns. It is the sum of the TC & and Transactional Cost Breakdown (12 and 36 months rolling) fund CLASS TER (12 months rolling)TER (36 months rolling)TC (36 months rolling)TIC (36 months rolling)Class A TER + TC = TICW here a transaction cost is not readily available a reasonable best estimate has been used. Estimated transaction costs may include Bond. Money Market and FX Costs (where applicable).The repor ted per formance of the fund is net of fees, while the per formance of the benchmark is gross of Performance: Morningstar Benchmark: Bloomberg*Annualized Return: is the weighted average compound growth rate over the per formance period measured.
3 The performance is calculated for the portfolio. The individual investor performance may differ as a result of initial fees, the actual investment date, the date of reinvestment and dividend withholding : Class AGeographic BreakdownTarget Market01020304050607080 North AmericaEurope ex UKEmerging MarketsJapanFar East ex JapanUnited TechnologyCommunication ServicesConsumer DiscretionaryHealth CareIndustrialsFinancialsUtilitiesMateri alsConsumer StaplesCashReal Electronics Incorporated Class Platforms Inc. Class Semiconductor Manufacturing promotes using the services of an accredited Financial Adviser when making investment contact either your accredited Financial Adviser or our Contact Centre on 011 448 6000 if you have any questions about this information below relates to the STANLIB High Alpha Global Equity fund a Class fund of STANLIB Funds year01/12/20-30/11/213 years01/12/18-30/11/215 years01/12/16-30/11/2110 years01/12/11-30/11/21 Portfolio Annualised Growth:Class tfolio Annualised Growth: Class tfolio Annualised Growth.
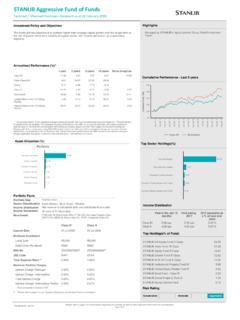
4 Class Annualised Return over 12 rolling Return over 12 rolling Rating ExplanationThe risk rating seen above is designed to give an indication of the level of risk, measured by volatility, associated with this specific order to arrive at the specific risk rating of the portfolio in question, STANLIB measures the volatility of the fund , in the form of standard deviation, over a three year rolling period, and compares the result to internal risk parameters. Please note that these risk ratings are designed as guide ManagerSTANLIB Asset Management Pty Limited Underlying Investment Manager Columbia-Threadneedle Asset ManagementLaunch Date2 May 1997 fund SizeUS $ millionDenominated inUS DollarsMin. Investment AmountUS$2,500 Min. Subsequent InvestmentUS$1,000 Upfront Charge (Maximum) Management Charge (AMC): Class Management Charge (AMC): Class Management Charge (AMC): Class A Intermediary Trail Commission (Paid from AMC) code: Class AGB00B0661199 ISIN code: Class B1JE00BD8 RJS41 ISIN code: Class B2JE00BD8RK140 Benchmark IndexBenchmark: MSCI AC World NTR IndexManager and AdministratorSTANLIB fund Managers Jersey LimitedTr u s te eApex Financial Services (Corporate) LimitedSTANLIB Global Equity FundThe fund is a class fund of STANLIB Offshore Unit Trusts which invests exclusively in the STANLIB Funds Limited - STANLIB High Alpha Global Equity Disclosure Document as at 30 November 2021 STANLIB Collective Investments (RF) Pty.
5 Limited. Registration number 1969/003468/07 ConservativeModerateAggressiveClass Funds are valued on a daily basis at 23h59 (UK Time). Transaction requests received before 14h30 (UK time) will receive the following days unit price. This is an accumulation portfolio and does not distribute income. Please refer to Statutory Disclosure and General Terms and ALLOCATION 0102030405060708090100 Equity PAGE 2 OF 217 Melrose Boulevard, Melrose Arch, 2196 PO Box 203, Melrose Arch, 2076Te l 0860 123 003 www number: D7R553 Publish date: 24 December 2021 fund Approach and StyleCollective investment schemes in securities are generally medium to long-term investments. The value of par ticipator y interests may go down as well as up and investors may get back less cash than originally invested. Past per formance is not necessarily a guide to future per formance. An investment in the par ticipations of a collective investment scheme in securities is not the same as a deposit with a banking institution.
6 Fluctuations or movements in exchange rates may cause the value of underlying international investments to go up or down. Par ticipator y interest prices are calculated on a net asset value basis, which is the total value of all assets less liabilities in the Class Funds including any provisions made for any purchase, fiscal or other charges that would have been incurred had all the assets of the relevant class fund been bought or sold at that time, divided by the number of par ticipator y interests in issue. Please refer to the prospectus for more details on the charges and expenses that may be recovered from the Class Funds. Par ticipator y interests are priced daily using the for ward pricing method. The Class Funds may borrow up to 10% of the market value of the Class Funds to bridge insufficient liquidity as a result of the redemption of participatory interests. Collective investment schemes are traded at ruling prices and can engage in borrowing and scrip schedule of fees and charges and maximum commissions is available on request from STANLIB fund Managers Jersey Limited, ( the Manager ).
7 The Class Funds of the STANLIB Offshore Unit Trusts scheme, are Feeder Funds which only invest in the participatory interests of a single Class fund of a collective investment scheme. In addition to the annual management charge, other fees are incurred by the trust (trustee, custodian and general expenses). There is no sales tax applicable in Jersey. Commission and incentives may be paid and if so, are included in the overall costs. The Class Funds of STANLIB Offshore Unit Trusts scheme are accumulation Class Funds and do not distribute income. Please refer to the prospectus of this scheme for more details, a copy of which is available on request from STANLIB Collective Investments (RF) Pty. Limited, ( STANLIB ), the address of which is 17 Melrose Boulevard, Melrose Arch, 2196, South Africa. The registered office of the Manager is Standard Bank House, 47-49 La Motte Street, St Helier, Jersey, Channel Islands. The Trustee is Apex Financial Services (Corporate) Limited, 12 Castle Street, St.
8 Helier, Jersey, Channel representative agreement exists between STANLIB Collective Investment (RF) Pty. Limited and STANLIB fund Managers Jersey Manager and trustee are regulated by the Jersey Financial Services Commission to conduct fund services Trust is regulated as a Collective Investment fund by the Jersey Financial Services quoted are from Morningstar for the period ending 30/11/2021 for a lump sum investment using NAV-NAV prices. Liberty is a member of the Association of Savings and Investment of South Manager does not provide any guarantee either with respect to the capital or the return of a por tfolio. The Manager has a right to close the portfolio to new investors in order to manage the portfolio more efficiently in accordance with its commentar y gives the view of the manager at the time of writing. Any forecasts or commentar y included in this document are not guarantee to occurStatutory Disclosure and General Terms & ConditionsWhere foreign securities are included in the por tfolio there may be additional risks, such as potential constraints on liquidity and the repatriation of funds, macroeconomic risks, political risks, tax risks, settlement risks and potential limitations on the availability of market information about this product, including brochures, application forms and annual or quarterly reports, can be obtained from the Manager, free of charge and from the website prices of unit trust funds are calculated and published on each working day.
9 These prices are available on the Manager s website ( ) and in the South African printed news informationFund Commentary: 3rd QuarterFund reviewGross of fees, the fund underperformed its benchmark over the quarter. Security selection was unhelpful, particularly in technology and financials, though consumer discretionary and healthcare added value. Sector allocation also weighed on relative returns, with the underweight in financials detracting most. At the stock level, detractors included Pinterest; shares fell after results showed that user growth slowed in the second quarter. However, we remain positive on the firm s prospects. Pinterest boasts a niche position in the social media space, thanks to its highly commercial content which provides a natural destination for brand and per formance adver tising. The company operates in a large, addressable market and offers exposure to e-commerce growth. Samsung Electronics also declined amid uncer tainty about the outlook for semiconductor demand.
10 However, our investment thesis remains intact. The firm has built a major Global footprint over time and enjoys a dominant position in its respective markets, including memory, OLED and consumer electronics. We believe the quality of Samsung s stable earnings profile is improving as it introduces new products with compelling growth prospects. Combined with the company s growing opportunities in areas such as 5G networking, the long-term outlook is promising. Google s parent company Alphabet outperformed. Shares rallied after the firm s second-quarter revenues and profits exceeded expectations, reflecting robust advertising spending. We feel that the market is underestimating the scale and sustainability of Alphabet's growth, which derives from the company s market leadership, broad network, amassment of data, and exposure to attractive secular trends such as digital advertising. Alphabet has also been adopting a more shareholder-friendly approach in recent years, by improving disclosure and returning cash to investors through share buybacks.