Transcription of STANLIB Property Income Fund
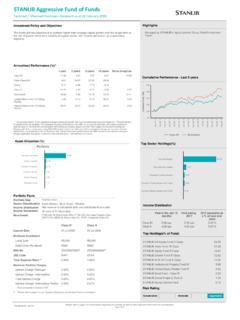
1 PortfolioAsset Allocation (%)Portfolio FactsNet revenue is calculated daily and distributed 8' millionSouth African - Real Estate - GeneralFTSE/JSE SA Listed Property Index (SAPY) 31 March, 30 June, 30 September & 31 DecemberBenchmarkIncome DistributionSector ClassificationPortfolio SizeIncome DeclarationJSE CodeSTPISPIFB1 ISIN Order Per MonthR500R500 Minimum InvestmentLump SumR5,000R5,000 Launch Date01 Jul 200229 Dec 2006 Total Expense Ratio ** AClass B1 Upfront Charge: Service Charge Intermediary Portfolio ChargesUpfront Charge: are quoted inclusive of refer to page 2 under Statutory Disclosure and General Terms & Conditions **Annualised Performance (%)*1 year3 years5 years10 yearsSince InceptionClass (Class B1)20/3910/319/234/17-Lowest Return over 12 Rolling Months Return over 12 Rolling Months *Annualized Return: is the weighted average compound growth rate over the performance period measured.
2 The performance is calculated for the portfolio. The individual investor performance may differ as a result of initial fees, the actual investment date,the date or reinvestment and dividend withholding quoted are from Morningstar for the period ending 31 December 2017 for a lump sum, using NAV-NAV prices and do not take any upfront manager's charge into account. Income distributions are declared on the ex-dividend date. Actual investment performance will differ based on the upfront manager's charge applicable, the actual investment date and the date of reinvestment of Policy and ObjectivesThe fund s primary objective is to provide investors with a steady source of Income and growth of Property Income FundFactsheet / Minimum Disclosure Document as at 31 December 2017 Please refer to page 2 for more details regarding this portfolio as well as other important information for considerationpg 1 of 3 Factsheet ID.
3 90238 Risk RatingConservativeModerateAggressiveTop Holdings(% of fund )NEPI ROCKCASTLE PLC Property Income Income fund Income fund B PLC Corporate Real Estate PROPERTIES LTD DistributionPaid in the last 12 monthsPaid during 20162016 payments as a % of year end priceClass %Class %Top Sector Holdings(%)Cumulative Performance - Last 5 yearsHighlights **.Raging Bull Award winner in 2005, 2008, 2009, 2010 and 2011..Morningstar/Micropal award winner in 2003, 2005, 2006, 2007, 2009 and is important to look at the total distribution over the full year because most companies have December or June year-ends and pay out their distributions in the 1st and 3rd quarters of the market risks include a decline in Property values, general market conditions, a rise in interest rates, currency volatility, economic conditions, share selection and bond yield fluctuations.
4 Where exposure to foreign investments is included in the fund there may be additional risks, such as potential constraints on liquidity and the repatriation of funds, macroeconomic risks, political risks, tax risks, settlement risks, and potential limitations on the availability of market Chartered Bank, 4 Sandown Valley Crescent, Sandton, 2196, Tel: 011 217 6600 Trustees :Statutory Disclosure and General terms & ConditionsCollective Investment Schemes in Securities (CIS) are generally medium to long term investments. The value of participatory interests may go down as well as up and past performance is not necessarily a guide to the future. An investment in the participations of a CIS in securities is not the same as a deposit with a banking institution. CIS are traded at ruling prices and can engage in borrowing and scrip lending.
5 A schedule of fees and charges and maximum commissions is available on request from STANLIB Collective Investments (RF) (PTY) Ltd (the Manager). Commission and incentives may be paid and if so, would be included in the overall costs. Forward pricing is used. Fluctuations or movements in exchange rates may cause the value of underlying international investments to go up or down. Liberty is a full member of the Association for Savings and Investments of South Africa. The Manager is a member of the Liberty Group of Companies. This portfolio is valued on a daily basis at 15h00. Investments and repurchases will receive the price of the same day if received prior to Total Expense Ratio (TER) of a portfolio is a measure of the portfolio s assets that were relinquished as operating costs expressed as a percentage of the daily average value of the portfolio calculated over a period of usually a financial year.
6 Typical expenses which are deducted from a portfolio include service charges, taxes, trustee fees and audit fees. The manager does not provide any guarantee either with respect to the capital or the return of a portfolio. The manager has a right to close the portfolio to new investors in order to manage the portfolio more efficiently in accordance with its mandate. Additional information about this product, including brochures, application forms and annual or quarterly reports, can be obtained from the Manager, free of charge, and from the website: The prices of unit trust funds are calculated and published on each working day. These prices are available on the Manager's website and in the South African printed news media.** HighlightsAwards details: Morningstar/Micropal Awards, 2003 - Best return over 1 year; 2005 and 2006 - Best return over 3 years; 2007 - Best return over 5 years; 2009 - Best return over 3 years; 2011 - Best return over 1 and 3 Bull Awards, 2005 - Best return over 3 years; 2008 - Best return over 5 years; 2009 - Best return over 3 and 5 years; 2010 - Best return over 5 years; 2011 - Best return over 3 and 5 Total Expense Ratio (TER) for this class or portfolio is indicated above, for the period from 10 Jan 2014 to 30 Sep 2017.
7 A higher TER ratio does not necessarily imply a poor return, nor does a low TER imply a good return. The current TER cannot be regarded as an indication of future STANLIB Property Franchise is committed to generating superior long-term risk adjusted returns based on thorough fundamental research. To achieve this, they invest with high conviction in companies that: Display quality long-term earnings prospects; Have a portfolio of assets with the potential to generate above average growth in their rental streams. Are trading at reasonable values relative to their growth prospects. The large, dedicated listed Property team ensures that detailed analysis can be done and that short term yield is not unnecessarily chased. fund FeaturesThe fund invests predominantly in listed Property shares mainly through Real Estate Investment Trusts (REITs) which offer investors exposure to real estate properties and mortgages through a JSE-listed instrument.
8 The fund s intention is to remain fully invested in Property . Cash and money market investments are limited to a maximum of 5% of the portfolio if considered 2 of 3 Contact DetailsSTANLIB Collective Investments (RF)Pty LimitedReg. No. 1969/003468/0717 Melrose BoulevardMelrose ArchJohannesburgSouth AfricaPO Box 202 Melrose Arch20760860 123 No :HX4138 Contact CentrePublished Date :1/25/2018 Quarterly CommentsFund OverviewThe fund underperformed the benchmark by over 12 months, delivering versus the benchmark return of Over the past quarter, the top contributors to fund performance were the underweight positions in Arrowhead and Nepi Rockcastle. The underweight position in Arrowhead was driven by our continued concerns on the overall quality of the South African portfolio, with an exceptionally weak outlook statement negatively impacting the stock.
9 On Nepi Rockcastle, we closed our underweight position materially in the quarter at an attractive entry price, given continuing strong portfolio fundamentals. The top detractors to fund performance were the overweight position in Hammerson and Delta. Hammerson continues to bear the brunt of concerns around the impact of Brexit, while Delta continues to be negatively impacted by uncertainty and delays on a BBBEE transaction that has not yet OverviewOn a total return basis, listed Property delivered in the quarter, outperforming local equities ( ), cash (+ ) and local bonds ( ). Even with the ZAR strengthening 7% against the Euro in the quarter, SAPY Property stocks linked to offshore-earnings delivered double-digit total returns over the quarter. Stocks with South African portfolios showed strong performances, with strong share price performance evident in late 4Q17 on the back of positive sentiment emerging around the ANC elective conference.
10 Over 2017, listed Property featured amongst the best performing asset classes ( total return), underperforming equities ( ), and outperforming cash ( ) and bonds ( ). Normal market behaviour of seeing investors either choose South African Property portfolios or offshore portfolios was upended in 4Q17. The top six performing stocks in 4Q17 comprising a mix of both offshore (NRP 16%, RES 14%, FFB: 9%) and local (GRT: 14%, IPF: 12%, HYP: 11%) focused stocks. This outcome manifested even with marginal bond weakness and material ZAR strength over the quarter. The fund does and continues to have exposure to all these names above, and continues to offer a balance between defensive South African Property portfolio exposure and strong offshore distribution growth exposure, underpinned by strong physical Property fundamentals in both instances.