Example: dental hygienist
Storing, analyzing, and presenting Stataoutput
Jul 15, 2010 · Optionally: p-values, t-stats, confidence intervals, covariances, and more User can optionally specify: Coefficient and variance-covariance matrices Labels Table format (Abbreviated) syntax: regsave [coeflist ] [using filename ] [, tstat pval ci level (#) addlabel (string ) addvar (string ) table (name , *) *] 8
Tags:
Information
Domain:
Source:
Link to this page:
Documents from same domain

Title stata.com generate — Create or change …
www.stata.comTitle stata.com generate — Create or change contents of variable SyntaxMenuDescriptionOptions Remarks and examplesMethods and formulasReferencesAlso see Syntax Create new variable generate type newvar

Title stata.com gettoken — Low-level parsing
www.stata.comTitle stata.com gettoken — Low-level parsing SyntaxDescriptionOptionsRemarks and examplesAlso see Syntax gettoken emname1 emname2: emname3, parse("pchars") quotes qed(lmacname) match(lmacname) bind

Syntax - Stata
www.stata.com2cluster kmeans and kmedians— Kmeans and kmedians cluster analysis Options Main k(#) is required and indicates that # groups are to be formed by the cluster analysis.

Syntax Description - Stata
www.stata.com2substr()— Extract substring Diagnostics In substr(s, b, l) and substr(s, b), if b describes a position before the beginning of the string or after the end, "" is returned.

Title stata.com graph box — Box plots
www.stata.comgraph box— Box plots 3 Menu Graphics > Box plot Syntax graph box yvars if in weight, options graph hbox yvars if in weight, options where yvars is a varlist options Description

Title stata
www.stata.comarea options — Options for specifying the look of special areas 3 Also see [G-2] graph dot — Dot charts (summary statistics)

www.stata.com
www.stata.com2cluster dendrogram— Dendrograms for hierarchical cluster analysis The height of the vertical lines and the range of the (dis)similarity axis give visual clues about the

Title stata.com putexcel — Export results to an Excel …
www.stata.computexcel— Export results to an Excel file 3 export options Description Main overwritefmt overwrite existing cell formatting when exporting new content

destring — Convert string variables to numeric ... - …
www.stata.comTitle stata.com destring — Convert string variables to numeric variables and vice versa SyntaxMenuDescription Options for destringOptions for tostringRemarks and …

SyntaxDescriptionRemarks and examplesAlso see
www.stata.commacro— Macro definition and manipulation 3 Macro extended functions related to matrices rownamesjcolnamesjrowfullnamesjcolfullnames matname roweqjcoleq
Related documents
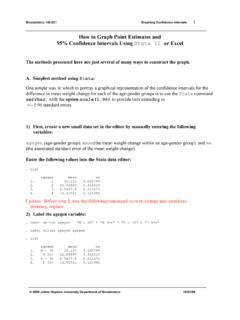
How to Graph Point Estimates and 95% Confidence Intervals ...
www.biostat.jhsph.edu95% Confidence Intervals Using Stata 11 or Excel The methods presented here are just several of many ways to construct the graph. A. Simplest method using Stata: One simple way in which to portray a graphical representation of the confidence intervals for the
MetaXL User Guide - EpiGear
www.epigear.comMeta-regression using MetaXL to create the dataset and Stata to run the regression ... RRCI Binary analysis, input in risk ratios and confidence intervals, output in risk ratios ORCI Binary analysis, input in odds ratios and confidence intervals, output in odds ratios . …
Documentation of Mandated Discharge Summary …
www.ahrq.govAnalyses were performed using SAS® version 9.1 and Stata® version 9.0. All confidence intervals (CI) and significance tests were significant at P < 0.05. The kappa statistic and percent agreements were calculated to measure abstraction reliability. 17, 18 . Results . Discharge Summary Characteristics and Joint Commission Component Definitions

Stata Example (See appendices for full example).
www3.nd.eduappendices for more ways of detecting problems using Stata.) ... confidence intervals for coefficients tend to be very wide and t- ... • Or, try a slightly different specification of a model using the same data. See if seemingly “innocuous” changes (adding a variable, dropping a variable, using a different ...
Stata: Visualizing Regression Models Using coefplot
opr.princeton.eduStata command for graphing results of Stata estimation commands user‐written ‐author: Ben Jann, University of Bern default behavior ‐plots markers for coefficients and horizontal spikes for confidence intervals features ‐results from multiple models can be displayed on a single graph
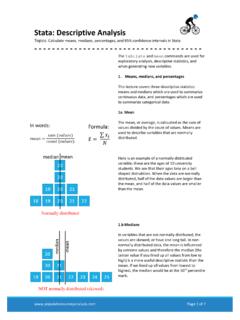
Stata: Descriptive Analysis
populationsurveyanalysis.comThe 95% confidence internval would be the spread of the middle 95 means. The 95% confidence interval represents a range of values that we are almost certain contains the real mean in the population. 2b. How to analyze skewed continous values Stata calculates 95% confidnece intervals for means and percentages. Stata will assume that any
Microeconometrics Using Stata - University of California ...
cameron.econ.ucdavis.eduMicroeconometrics Using Stata Second Edition A. COLIN CAMERON Department of Economics University of California, Davis, CA and School of Economics University of Sydney, Sydney, Australia PRAVIN K. TRIVEDI School of Economics University of Queensland, Brisbane, Australia and Department of Economics Indiana University, Bloomington, IN A Stata ...
Religion and Health: A Synthesis - Harvard University
pik.fas.harvard.educonfidence intervals. The p-value is a measure of how likely the outcome obtained, or one more extreme, would be if there were in fact no true association and the result was simply due to chance. More formally, it is the probability of obtaining a result as extreme or more extreme than the one actually obtained if there were in fact no true
Getting Started in Logit and Ordered Logit Regression
www.princeton.eduPU/DSS/OTR Logit model • Use logit models whenever your dependent variable is binary (also called dummy) which takes values 0 or 1. • Logit regression is a nonlinear regression model