Example: quiz answers
Syntax - Stata
[G-3] connect options discusses options for one y versus one x, see connect options in[G-2] graph twoway scatter when plotting multiple ys against one x. axis choice options associate the plot with a particular y or x axis on the graph; see [G-3] axis choice options. twoway options are a set of common options supported by all twoway graphs.
Tags:
Information
Domain:
Source:
Link to this page:
Documents from same domain

Title stata.com graph box — Box plots
www.stata.comgraph box— Box plots 3 Menu Graphics > Box plot Syntax graph box yvars if in weight, options graph hbox yvars if in weight, options where yvars is a varlist options Description

Title stata
www.stata.comarea options — Options for specifying the look of special areas 3 Also see [G-2] graph dot — Dot charts (summary statistics)

destring — Convert string variables to numeric ... - …
www.stata.comTitle stata.com destring — Convert string variables to numeric variables and vice versa SyntaxMenuDescription Options for destringOptions for tostringRemarks and …

Syntax - Stata
www.stata.com2cluster kmeans and kmedians— Kmeans and kmedians cluster analysis Options Main k(#) is required and indicates that # groups are to be formed by the cluster analysis.

Title stata.com generate — Create or change …
www.stata.comTitle stata.com generate — Create or change contents of variable SyntaxMenuDescriptionOptions Remarks and examplesMethods and formulasReferencesAlso see Syntax Create new variable generate type newvar

Title stata.com putexcel — Export results to an Excel …
www.stata.computexcel— Export results to an Excel file 3 export options Description Main overwritefmt overwrite existing cell formatting when exporting new content

Title stata.com gettoken — Low-level parsing
www.stata.comTitle stata.com gettoken — Low-level parsing SyntaxDescriptionOptionsRemarks and examplesAlso see Syntax gettoken emname1 emname2: emname3, parse("pchars") quotes qed(lmacname) match(lmacname) bind

Syntax Description - Stata
www.stata.com2substr()— Extract substring Diagnostics In substr(s, b, l) and substr(s, b), if b describes a position before the beginning of the string or after the end, "" is returned.

SyntaxDescriptionRemarks and examplesAlso see
www.stata.commacro— Macro definition and manipulation 3 Macro extended functions related to matrices rownamesjcolnamesjrowfullnamesjcolfullnames matname roweqjcoleq

www.stata.com
www.stata.com2cluster dendrogram— Dendrograms for hierarchical cluster analysis The height of the vertical lines and the range of the (dis)similarity axis give visual clues about the
Related documents

Multilevel Modeling in R (2.7)
cran.r-project.orginteraction plot (many more recent plotting packages were designed to work with lme4 rather than nlme). 2 Reading data from files Before detailing multilevel analyses, I provide a short section on reading in data. There are numerous options for reading in data, so this section is in no way exhaustive. I provide what has
AIA CAD Layer Guidelines - Duke University
facilities.duke.edu6.11 NCS and ISO 13567 Implementation Options 6.12 NCS and ISO 13567 Implementation Guidelines Virtually all vector-based CAD systems support the concept of layers. This function allows building design ... the Uniform Drawing System and the Plotting Guidelines, respectively, into the NCS. These four constituent publishers, as they came to be ...
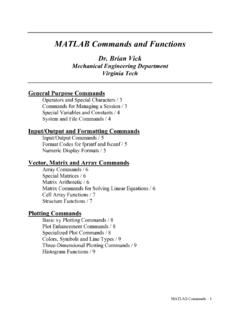
MATLAB Commands and Functions - University of Minnesota
www.hkn.umn.eduPlotting Commands Basic xy Plotting Commands axis Sets axis limits. fplot Intelligent plotting of functions. grid Displays gridlines. plot Generates xy plot. print Prints plot or saves plot to a file title Puts text at top of plot. xlabel Adds text label to x-axis. ylabel Adds text label to y-axis. Plot Enhancement Commands axes Creates axes ...

Solving ODE in MATLAB - Texas A&M University
www.math.tamu.eduSeveral options are available for MATLAB’s ode45 solver, giving the user lim- ited control over the algorithm. Two important options are relative and absolute tolerance,

Fault Current Calculations and NEC Requirements
www.cce.umn.edu• Use time current curves to identify types and options of CBs required to achieve selective coordination (select breaker needed eliminate overlap of curves for fault current available) • Even small changes in fault current can result in lack of compliance Short-Circuit Current Study By Ace Engineering 10 100 1K 10K 100K 0.01 0.10 1 10 100 1000
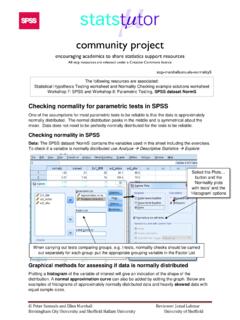
Checking normality in SPSS - University of Sheffield
www.sheffield.ac.ukPlotting a histogram of the variable of interest will give an indication of the shape of the distribution. A normal approximation curvecan also be added by editing the graph. Below are examples of histograms of approximately normally distributed data and heavily skewed data with equal sample sizes. Select the Plots… button and the ...

Gretl User's Guide
gretl.sourceforge.netGretl User’s Guide Gnu Regression, Econometrics and Time-series Library Allin Cottrell Department of Economics Wake Forest University Riccardo “Jack” Lucchetti

Lecture 11 Results and Post Processing - Rice University
www.clear.rice.edu1 © 2015 ANSYS, Inc. February 27, 2015 16.0 Release Lecture 11 Results and Post Processing Introduction to ANSYS Mechanical