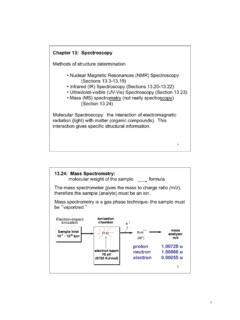
Transcription of The Basics of UV-Vis Spectroscopy
1 The Basics of UV-Vis Spectrophotometry A primer Contents 1 Basic Principles of UV-Vis Measurement 3. The electromagnetic spectrum 3. Wavelength and frequency 3. UV- visible spectra 3. Transmittance and absorbance 4. Summary 4. 2 How Does a Modern UV-Vis Spectrophotometer Work? 5. Instrumental design 7. 3 Selecting the Optimum Parameters for your 13. UV-Vis Measurements Optical cell selection 13. Thermostatting your samples 16. Stirring your sample 16. Measurements at low temperatures 16. Solvent transparency 17. Optimum spectral band width 18. Stray light 19. The linear range of a UV-Vis instrument 19. Other useful information 20. Wavelength or inverse centimeters 20. 4 Overview of Common UV-Vis Applications 21. Identification spectra and structure 21. Confirmation of identity 22. Quantifying a molecule 22. Kinetics 24. Color measurement 26. Structural changes of compounds 28. Protein and nucleic acid melting temperature 28.
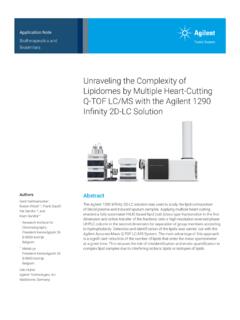
2 Multi-component analysis 30. Software requirements 32. 5 Glossary 34. 2. 1. Basic Principles of UV-Vis Measurement The electromagnetic spectrum wavelength UV light has the highest energy. Sometimes, this energy may be sufficient to cause unwanted photochemical reactions when measuring ultraviolet (UV) and visible radiation are a small part of the electromagnetic samples that are photosensitive. spectrum, which includes other forms of radiation such as radio, infrared (IR), cosmic, and X rays. UV- visible spectra Frequency [Hz]. When radiation interacts with matter, several processes can 1022 1019 1017 1015 1014 1010 106 103 1 10-3 occur, including reflection, scattering, absorbance, fluorescence/. phosphorescence (absorption and re-emission), and photochemical Gamma ray Cosmic ray Microwave Television ultraviolet Infrared visible HIGHER LOWER. Radar Radio X ray NMR. ENERGY ENERGY reactions (absorbance and bond breaking).
3 Typically, when measuring samples to determine their UV- visible spectrum, absorbance is measured. 10-14 10-12 10-10 10-8 10-6 10-4 10-2 1 102 104 106 108 1010. Wavelength [m] Because light is a form of energy, absorption of light by matter causes the energy content of the molecules (or atoms) in the matter to increase. The total potential energy of a molecule is represented as the sum of its ultraviolet visible Infrared electronic, vibrational, and rotational energies: Figure 1. The electromagnetic spectrum, with the visible light section expanded. Etotal = Eelectronic + Evibrational + Erotational The energy associated with electromagnetic radiation is defined as: The amount of energy a molecule possesses in each form is not a E = h continuum but a series of discrete levels or states. The differences in where E is energy (in joules), h is Planck's constant ( 10 -34 Js), and energy among the different states are in the order: is frequency (in seconds).
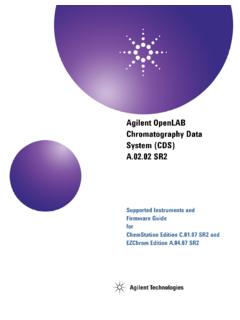
4 Eelectronic > Evibrational > Erotational Spectroscopy allows the study of how matter interacts with or emits In some molecules and atoms, incident photons of UV and visible light have electromagnetic radiation. There are different types of Spectroscopy , enough energy to cause transitions between the different electronic energy depending on the wavelength range that is being measured. UV-Vis levels. The wavelength of light absorbed has the energy required to move an Spectroscopy uses the ultraviolet and visible regions of the electromagnetic electron from a lower energy level to a higher energy level. Figure 2 shows spectrum. Infrared Spectroscopy uses the lower energy infrared part of an example of electronic transitions in formaldehyde and the wavelengths the spectrum. of light that cause them. Wavelength and frequency H. Electromagnetic radiation can be considered a combination of alternating electric and magnetic fields that travel through space in a wave motion.
5 H C O. Because radiation acts as a wave, it can be classified in terms of either C O H. wavelength or frequency, which are related by the following equation: H pi pi*. transition = c/ n pi* H (187 nm). transition where is frequency (in seconds), c is the speed of light (3 108. ms ), and -1. (285 nm) C O. is wavelength (in meters). H. In UV-Vis Spectroscopy , wavelength is usually expressed in nanometers Figure 2. Electronic transitions in formaldehyde. UV light at 187 nm causes excitation of (1 nm = 10 -9 m). It follows from the equations that radiation with shorter an electron in the C-O bond and light at 285 nm wavelength causes excitation and transfer wavelength has higher energy, and, for UV-Vis Spectroscopy , the low (short) of an electron from the oxygen atom to the C-O bond. 3. These transitions result in very narrow absorbance bands at wavelengths Transmittance and absorbance highly characteristic of the difference in energy levels of the absorbing When light passes through or is reflected from a sample, the amount of species.
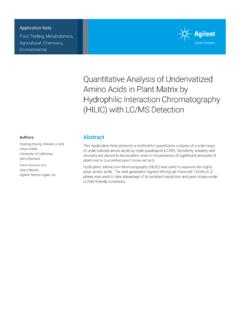
6 This is also true for atoms, as depicted in Figure 3. light absorbed is the difference between the incident radiation (Io ) and Energy level 3. the transmitted radiation (I). The amount of light absorbed is expressed Energy level 2. Energy level 1.. Light of speci c wavelength absorbed as absorbance. Transmittance, or light that passes through a sample, is Energy level 0 usually given in terms of a fraction of 1 or as a percentage and is defined as follows: . T = I / Io or %T = I/Io 100.. Absorbance is defined as follows: A = logT. E E I For most applications, absorbance values are used since the relationship S2. between absorbance and both concentration and path length is normally S0 S2. linear (as per the Beer Lambert law, described in section ). S1. Summary S0 S1. S0. UV and visible light are part of the electromagnetic spectrum In UV-Vis Spectroscopy wavelength is expressed in nanometers (nm).
7 S0 S2 S0 S1 . Light can be reflected, scattered, transmitted or absorbed from matter, Figure 3. Incident light of a specific wavelength causes excitation of electrons in an atom. and can cause photochemical reactions to occur The type of atom or ion ( which element it is) and the energy levels the electron is moving between determines the wavelength of the light that is absorbed. Transitions can Energy from incident light causes electrons to transition to different be between more than one energy level, with more energy lower wavelengths of light, energy levels. Electronic transitions also occur between the vibrational required to move the electron further from the nucleus. and rotational energy levels of molecules However, for molecules, vibrational and rotational energy levels are Absorbance of light is used for most UV-Vis Spectroscopy applications. superimposed on the electronic energy levels.
8 Because many transitions with It is defined as A=-logT, where T is transmittance. different energies can occur, the bands are broadened (see Figure 4). The broadening is even greater in solutions owing to solvent-solute interactions. E electronic energy levels vibrational energy levels rotational energy levels electronic transition S2. I. S1. S0.. Figure 4. Electronic transitions and UV- visible spectra in molecules (I is intensity and is wavelength). 4. 2. How Does a Modern UV-Vis Spectrophotometer Work? ultraviolet visible ( UV-Vis ) spectrophotometers use a light source to illuminate a sample with light across the UV to the visible wavelength range (typically 190 to 900 nm). The instruments then measure the light absorbed, transmitted, or reflected by the sample at each wavelength. Some spectrophotometers have an extended wavelength range, into the near-infrared (NIR) (800 to 3200 nm). Abs 265 270.
9 Wavelength (nm). Figure 5. A UV absorbance spectrum, showing an absorbance peak at approximately 269 nm. From the spectrum obtained, such as the one shown in Figure 5, it is possible to determine the chemical or physical properties of the sample. In general, it is possible to: Identify molecules in a solid or liquid sample Determine the concentration of a particular molecule in solution Characterize the absorbance or transmittance through a liquid or solid . over a range of wavelengths Characterize the reflectance properties of a surface or measuring the color of a material Study chemical reactions or biological processes. Various types of measurements can be performed by combining different Figure 6. A fiber-optic probe accessory can be fitted to a UV-Vis spectrophotometer to measure liquid samples in a range of containers. accessories and sample holders with the UV-Vis spectrophotometer. Different accessories exist for different measurement capabilities and UV-Vis spectrophotometry is a versatile technique and has been used for sample types, , solids versus liquids, and for different measurement close to a century in a wide range of fields.
10 UV-Vis spectrophotometers are conditions (Figure 6 and 7). in common use in material testing/research, chemistry/petrochemistry, and biotechnology/pharmaceuticals laboratories. 5. Figure 7. A solid sample, like this polycrystalline photovoltaic solar cell, can be measured using a UV-Vis spectrophotometer. 6. Instrumental design Components The key components of a spectrophotometer are: A light source that generates a broadband of electromagnetic radiation across the UV- visible spectrum A dispersion device separates the broadband radiation into wavelengths A sample area, where the light passes through or reflects off a sample One or more detectors to measure the intensity of the reflected or transmitted radiation Other optical components, such as lenses, mirrors, or fiber-optics, relay light through the instrument. Figure 8. Schematic of the internal layout of an Agilent Cary 5000 UV-Vis -NIR. spectrophotometer, showing the main components.