Example: confidence
Title stata.com append — Append datasets
We will append the even data to the end of the odd data. Because the odd data are already in memory (we just used them above), we type append using even. The result is. append using even. list number odd even 1. 1 1 . 2. 2 3 . 3. 3 5 . 4. 4 7 . 5. 5 9 . 6. 6 . 12 7. 7 . 14 8. 8 . 16
Tags:
Information
Domain:
Source:
Link to this page:
Documents from same domain

Syntax - Stata
www.stata.com2cluster kmeans and kmedians— Kmeans and kmedians cluster analysis Options Main k(#) is required and indicates that # groups are to be formed by the cluster analysis.

Syntax Description - Stata
www.stata.com2substr()— Extract substring Diagnostics In substr(s, b, l) and substr(s, b), if b describes a position before the beginning of the string or after the end, "" is returned.

Title stata.com generate — Create or change …
www.stata.comTitle stata.com generate — Create or change contents of variable SyntaxMenuDescriptionOptions Remarks and examplesMethods and formulasReferencesAlso see Syntax Create new variable generate type newvar

SyntaxDescriptionRemarks and examplesAlso see
www.stata.commacro— Macro definition and manipulation 3 Macro extended functions related to matrices rownamesjcolnamesjrowfullnamesjcolfullnames matname roweqjcoleq

Title stata.com graph box — Box plots
www.stata.comgraph box— Box plots 3 Menu Graphics > Box plot Syntax graph box yvars if in weight, options graph hbox yvars if in weight, options where yvars is a varlist options Description

Title stata
www.stata.comarea options — Options for specifying the look of special areas 3 Also see [G-2] graph dot — Dot charts (summary statistics)

www.stata.com
www.stata.com2cluster dendrogram— Dendrograms for hierarchical cluster analysis The height of the vertical lines and the range of the (dis)similarity axis give visual clues about the

Title stata.com putexcel — Export results to an Excel …
www.stata.computexcel— Export results to an Excel file 3 export options Description Main overwritefmt overwrite existing cell formatting when exporting new content

destring — Convert string variables to numeric ... - …
www.stata.comTitle stata.com destring — Convert string variables to numeric variables and vice versa SyntaxMenuDescription Options for destringOptions for tostringRemarks and …

Title stata.com gettoken — Low-level parsing
www.stata.comTitle stata.com gettoken — Low-level parsing SyntaxDescriptionOptionsRemarks and examplesAlso see Syntax gettoken emname1 emname2: emname3, parse("pchars") quotes qed(lmacname) match(lmacname) bind
Related documents
Merge/Append using Stata - Princeton University
www.princeton.eduappend using mydata8 mydata7 mydata8 • Make sure one dataset is loaded into Stata (in this case mydata7), then use append. • Make sure to map where the using data is located (in this case mydata2, for example “c: \folders\data\mydata8.dta”)*. *To set the working directory see here

A QUICK STATA GUIDE: APPEND, MERGE, AND COLLAPSE 2. …
jearl.faculty.arizona.eduappend using dataset.dta The append command combines the dataset in memory, known as the master dataset, with a dataset on disk, known as the using dataset. Typically, a user would implement the append command when they would like to add observations to an existing dataset with the same or

Getting Started in Data Analysis using Stata
dss.princeton.edulog using mylog.log, append . To replace a log file add the option replace, type: log using mylog.log, replace . Note that the option replace will delete the contents of the previous version of the log. First steps: memory allocation . Stata 12+ will automatically allocate the necessary memory to open a file. It is recommended to

5.7 Appendix: Using R for Sampling Distributions
pages.stat.wisc.edu5.7.1 Simulations using a Discrete Distribution Let us first consider a simulation example that illustrates Var(X¯) = σ2/n. Consider a discrete random variable with probability function given by the following. x p(x) 1 0.6 3 0.3 5 0.1 By using the methods from Sections 3.6 and 3.7, we find that E(X) = 2.0 and Var(X) = 1.8.

7.6.2 Appendix: Using R to Find Confidence Intervals
pages.stat.wisc.edu7.6.2 Appendix: Using R to Find Confidence Intervals by EV Nordheim, MK Clayton & BS Yandell, October 30, 2003 The tinterval command of R is a useful one for finding confidence intervals for the mean when the data are normally distributed with unknown variance. We illustrate the use of this command for the lizard tail length data.

Booth Multiplier Implementation of Booth’s Algorithm using ...
www.vlsiip.comevaluate MxR using the algorithm explained above. Given that R = 10011, we append Z to R to make the new R as 10011Z, where Z = 0, so new R = 1 0 0 1 1 0, now, clearly C4 = 10, S4 = -1 C3 = 00, S3 = 0 C2 = 01, S2 = +1 C1 = 11, S1 = 0 C0 = 10, S0 = -1 pp0 = M*S0 pp1 = M*S1 pp2 = M*S2 pp3 = M*S3 pp4 = M*S4 now to obtain the final product, we ...
The Google File System
pdos.csail.mit.eduMoreover, GFS has snapshot and record append opera-tions. Snapshot creates a copy of a file or a directory tree at low cost. Record append allows multiple clients to ap-pend data to the same file concurrently while guaranteeing the atomicity of each individual client’s append. It is use-ful for implementing multi-way merge results and producer-
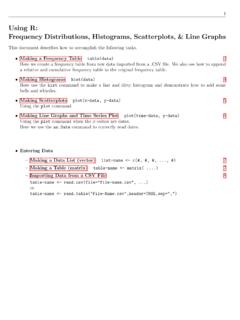
Using R: Frequency Distributions, Histograms, Scatterplots ...
cosmosweb.champlain.eduHere we have R create a frequency table and then append a relative and cumulative table to it. Everything in red is typed by the user.Everything in blue is output to the console. { The classes are de ned by creating a list of class boundaries.

Using outreg2 to report regression output, descriptive ...
www.princeton.eduUsing outreg2 to report regression output, descriptive statistics, frequencies and basic crosstabulations (v1.6 draft) Oscar Torres-Reyna otorres@princeton.edu