Transcription of TROPICAL STORM DORIAN
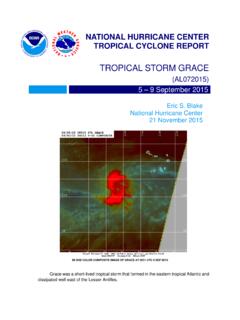
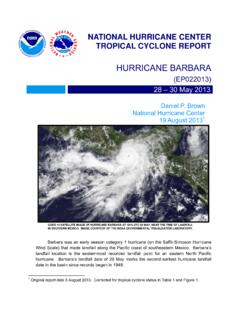
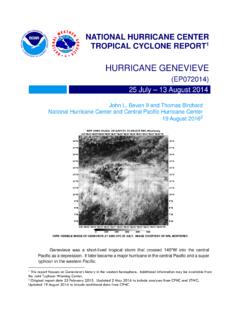
1 NATIONAL HURRICANE CENTER. TROPICAL CYCLONE REPORT. TROPICAL STORM DORIAN . (AL042013). 23 July 3 August 2013. Daniel P. Brown National Hurricane Center 17 October 20131. GOES 13 SATELLITE IMAGE OF TROPICAL STORM DORIAN OVER. THE EASTERN TROPICAL ATLANTIC AT 1445 UTC 24 JULY 2013. DORIAN was a TROPICAL STORM that formed over the far eastern Atlantic and then degenerated into a trough of low pressure east of the northern Leeward Islands. Several days later the system was briefly a TROPICAL depression again near the northwestern Bahamas. 1. Original report date 30 September 2013. Corrected cyclone status in Table 1. TROPICAL STORM DORIAN 2. TROPICAL STORM DORIAN 23 JULY 3 AUGUST 2013. SYNOPTIC HISTORY.
2 DORIAN developed from a strong TROPICAL wave that moved off of the west coast of Africa early on 22 July. The wave was accompanied by an area of low pressure that became well defined to the south-southeast of the cape Verde Islands the next day. The associated convection became organized in a band around the southern and southwestern portions of the circulation, which resulted in the formation of a TROPICAL depression at 1800 UTC 23 July about 150 n mi south of the cape Verde Islands. The best track chart of the TROPICAL cyclone's path is given in Fig. 1, with the wind and pressure histories shown in Figs. 2 and 3, respectively. The best track positions and intensities are listed in Table 12.
3 After formation, deep convection continued to increase and become more organized around the center. This led to strengthening and the depression became a TROPICAL STORM at 0600 UTC 24 July, when it was located about 160 n mi west-southwest of the southwesternmost cape Verde Islands. DORIAN moved west-northwestward at 15 to 20 kt to the south of a deep- layer ridge that extended across the central and eastern Atlantic Ocean during the TROPICAL STORM 's existence. The TROPICAL STORM continued to steadily strengthen as it remained in a low vertical wind shear environment and over sea surface temperatures of around 26 C. DORIAN reached its peak intensity of 50 kt at 0600 UTC 25 July (Fig. 4) while located about 525 n mi west of the southwesternmost cape Verde Islands.
4 Shortly thereafter, DORIAN moved over slightly cooler waters and began ingesting drier mid-level air, which caused the TROPICAL STORM to weaken slightly. Despite moving over warmer waters the following day, the entrainment of dry mid-level air along with moderate shear, primarily due to strong low- to mid-level easterly flow, caused the deep convection to decrease and become less organized. This resulted in additional weakening of DORIAN . The next day, scatterometer data indicated that the circulation was becoming less defined and by 1800 UTC 27 July, DORIAN degenerated into a trough of low pressure about 500 n mi east of the northeastern Leeward Islands. Over the next few days, the remnants of DORIAN continued to produce intermittent bursts of deep convection while the system gradually weakened and moved westward to west- northwestward, passing to the north of the Leeward Islands and Puerto Rico.
5 The system began to slow down on 30 July when it approached the Turks and Caicos Islands. Over the 2. A digital record of the complete best track, including wind radii, can be found on line at Data for the current year's storms are located in the btk directory, while previous years' data are located in the archive directory. TROPICAL STORM DORIAN 3. next couple of days the remnants of DORIAN produced disorganized convection while moving west-northwestward at 5 to 10 kt across the southeastern Bahamas. On 1 August, while the disturbance was moving across the central Bahamas, it turned northwestward when it reached the western portion of a low-level ridge over the southwestern Atlantic. Early the next day, the system turned northward and moved between the coast of southeastern Florida and the northwestern Bahamas, and by 1200 UTC, a broad low pressure area formed off of the east coast of Florida.
6 The low became better defined during the day and the associated convection gained enough organization for the system to be analyzed as a TROPICAL depression at 1800 UTC 2 August, when it was centered about 65 n mi northwest of Freeport, Bahamas. As the depression moved northward later that day, deep convection increased over the southern portion of the circulation and the system strengthened slightly. The depression began to accelerate northward to the east of the Florida Peninsula early on 3. August. Strong northerly upper-level winds caused the convection to separate from the low- level center and the depression degenerated into a remnant low by 1800 UTC 3 August about 145 n mi southeast of Charleston, South Carolina.
7 The remnant low turned northeastward and was absorbed by a frontal trough off the coast of North Carolina shortly after 0600 UTC 4. August. METEOROLOGICAL STATISTICS. Observations in DORIAN (Figs. 2 and 3) include subjective satellite-based Dvorak technique intensity estimates from the TROPICAL Analysis and Forecast Branch (TAFB) and the Satellite Analysis Branch (SAB). Observations also include flight-level and stepped frequency microwave radiometer (SFMR) observations from two flights of the 53rd Weather Reconnaissance Squadron of the U. S. Air Force Reserve Command. Data and imagery from NOAA polar-orbiting satellites including the Advanced Microwave Sounding Unit (AMSU), the NASA TROPICAL Rainfall Measuring Mission (TRMM), the European Space Agency's Advanced Scatterometer (ASCAT), and Defense Meteorological Satellite Program (DMSP) satellites, among others, were also useful in constructing the best track of DORIAN .
8 DORIAN and its remnants were well sampled by ASCAT, as a total of 35 passes provided useful wind and/or center position information during the system's lifetime. The estimated 50-kt peak intensity of DORIAN is based on two ASCAT passes around 1200 UTC 25 August that indicated winds of 43 to 48 kt. There were no reports of TROPICAL - STORM -force winds from any ships or land stations in association with DORIAN . CASUALTY AND DAMAGE STATISTICS. There were no reports of damage or casualties associated with DORIAN . TROPICAL STORM DORIAN 4. FORECAST AND WARNING CRITIQUE. The development of DORIAN was not particularly well anticipated. The TROPICAL wave from which DORIAN formed was introduced into the TROPICAL Weather Outlook at 1200 UTC 22 July.
9 At the time, the wave had just emerged from the west coast of Africa and the system was assigned a low chance (less than 30%) of formation during the next 48 h. The chance of genesis was raised to the medium category (30 to 50%) 6 h later, about 24 h before formation. The chance of development reached the high category (greater than 50%) at the time of genesis in the best track. The re-formation of DORIAN into a TROPICAL depression on 2 August was also not well anticipated. After being assessed a low or medium chance of formation for a few days after DORIAN degenerated into a TROPICAL wave, the remnants of DORIAN were removed from the TROPICAL Weather Outlook at 0600 UTC 31 July. The system was reintroduced and assigned a low chance of formation at 1800 UTC 1 August, about 24 h before re-formation.
10 The chance of development was raised to the medium category 6 h later, where it remained until re- development occurred at 1800 UTC 2 August. A verification of NHC official track forecasts for DORIAN is given in Table 2a. Official forecast (OFCL) track errors were much lower than the mean track errors for the previous 5-yr period. A homogeneous comparison of the official track errors with selected guidance models is given in Table 2b. The NHC forecasts exhibited lower mean track errors than all of the individual dynamical models at each verifying time, except at 36 h where the GFDL (GHMI) had a slightly lower average error. Both the TVCA and FSSE consensus models slightly bettered OFCL at 24 and 36 h, and the TVCA also performed slightly better at 48 hours.