U.S. dry natural gas production and consumption
U.S. natural gas and liquefied natural gas (LNG) trade 9 Reference case trillion cubic feet (Tcf) -13.7 0.0 13.7 27.4 41.1-5 0 5 10 15 2010 2020 2030 2040 2050 2020 history projections-13.7 0.0 13.7 27.4 41.1-5 0 5 10 15 2010 2020 2030 2040 2050-5 0 5 10 15 2010 2020 2030 2040 2050 2020 history projections
Tags:
Natural, Liquefied, Natural gas, Liquefied natural gas
Information
Domain:
Source:
Link to this page:
Please notify us if you found a problem with this document:
Documents from same domain
Natural Gas Monthly - Energy Information …
www.eia.govJune 2018 ii U.S. Energy Information Administration | Natural Gas Monthly This report was prepared by the U.S. Energy Information Administration (EIA), the …
Administration, Information, Energy, Natural, Monthly, Energy information administration, Natural gas monthly, Energy information
Weekly Petroleum Status Report
www.eia.govv Weekly Petroleum Status Report/Energy Information Administration U.S. crude oil refinery inputs averaged 17.2 million barrels per day during the week ending July 13, 2018, which was 413,000 barrels per
Administration, Information, Report, Energy, Status, Petroleum, Week, Petroleum status report, Energy information administration
Cost and Performance Characteristics of New …
www.eia.govU.S. Energy Information Administration | Cost and Performance Characteristics of New Generating Technologies, Annual Energy Outlook 2018 1
Administration, Information, Performance, Cost, Energy, Characteristics, Generating, Energy information administration, Cost and performance characteristics of new, Cost and performance characteristics of new generating
2016 Average Monthly Bill- Residential
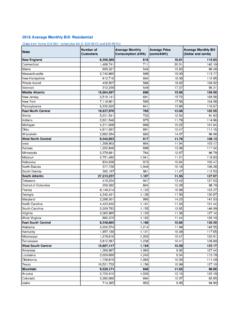
www.eia.gov2016 Average Monthly Bill- Residential (Data from forms EIA-861- schedules 4A-D, EIA-861S and EIA-861U) State Number of Customers Average Monthly
Oil market outlook and drivers - U.S. Energy …
www.eia.govWorld supply and demand million barrels per day implied stock change million barrels per day NAS | Oil market outlook and drivers, May 4, 2016 Global supply has consistently exceeded demand since the start of 2014;
Year-over-year summary July 2018
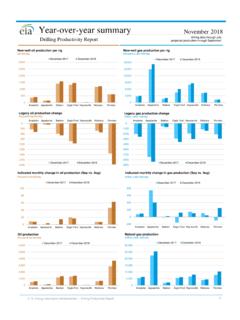
www.eia.govU. S. Energy Information Administration | Drilling Productivity Report 0 1,000 2,000 3,000 4,000 5,000 Anadarko Appalachia Bakken Eagle Ford Haynesville Niobrara Permian
Administration, Information, Year, Energy, Summary, Over, Energy information administration, Year over year summary
U.S. Energy Information Administration
www.eia.govIndependent Statistics & Analysis Drilling Productivity Report July 2018 For key tight oil and shale gas regions U.S. Energy Information Administration
Administration, Information, Report, Energy, Drilling, Energy information administration, Productivity, Drilling productivity report
Monthly Energy Review - Energy Information …
www.eia.govMonthly Energy Review The Monthly Energy Review (MER) is the U.S. Energy Information Administration’s (EIA) primary report of recent and historical energy statistics. Included are statistics on total energy production, consump
Administration, Information, Energy, Energy information administration, Energy information
STEO Current/Previous Forecast Comparisons: U.S. …
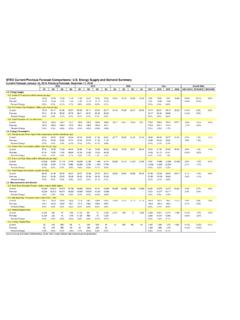
www.eia.govCurrent Forecast: July 10, 2018; Previous Forecast: June 12, 2018 Q1 Q2 Q3 Q4 Q1 Q2 Q3 Q4 Q1 Q2 Q3 Q4 2016 2017 2018 2019 2016-2017 2017-2018 2018-2019
Comparison, Current, Forecast, Previous, Steo current previous forecast comparisons, Steo
PADD 5 Transportation Fuels Markets - U.S. Energy ...
www.eia.govU.S. Energy Information Administration | PADD 5 Transportation Fuels Markets i . This report was prepared by the U.S. Energy Information Administration (EIA), the …
Administration, Information, Market, Energy, Transportation, Energy information administration, Fuel, Padd 5 transportation fuels markets, Padd
Related documents
Country Analysis Executive Summary: Malaysia
www.eia.govJan 25, 2021 · • Malaysia is the second-largest oil and natural gas producer in Southeast Asiaand is the fifth-largest exporter of liquefied natural gas (LNG) in the world, as of 2019. It is strategically located on important routes for seaborne energy trade.1 • Malaysia’s energy industry is an important sector of growth for the economy. The
Analysis, Country, Summary, Executive, Malaysia, Natural, Liquefied, Natural gas, Liquefied natural gas, Country analysis executive summary
LNG BUNKERING TECHNICAL AND OPERATIONAL ADVISORY
ww2.eagle.orgregulatory framework associated with LNG bunkering in North America, refer to the ABS report, Bunkering of Liquefied Natural Gas-fueled Marine Vessels in North America. This Advisory does, however, provide guidance on the ramifications of the various requirements on vessel design and operational issues, and how they impact the LNG bunkering ...
The World’s Top 10 LNG Terminals To meet the world’s ...
www.iqpc.comThe World’s Top 10 LNG Terminals Liquefied Natural Gas (LNG) is fast becoming the low carbon alternative fuel of choice for domestic, marine and automotive consumption. To meet the world’s increasing demand there are currently more than 40 on-going LNG import terminal construction projects across the globe set to come online in the next 5 ...
Liquefied Natural Gas - Energy
www.energy.govnatural gas will be transported via ship in the form of liquefied natural gas (LNG). Net imports of LNG are expected to increase from 0.6 Tcf in 20044 to more than 6 Tcf in 2025—at that point satisfying almost 21 percent of total U.S. natural gas demand.5 Discussions of the benefits and risks of expanding LNG
LIQUEFIED PETROLEUM GAS LAWS AND RULES
www.fdacs.govCompressed natural gas (CNG) and liquefied natural gas (LNG) are not considered liquefied petroleum gases as covered throughout this document. All liquefied petroleum gases are safe and efficient energy sources when used in accordance with proper safety and handling procedures. These gases are used in a variety of
Chapter 4: Natural Gas - GOV.UK
assets.publishing.service.gov.ukChart 4.3 Imports of natural gas, 2010-2020 (DUKES Table 4.5) In 2020, imports were down 6.5 per cent on 2019. This was partly due to low demand. Imports arrive via pipeline; the UK imports natural gas via pipeline from Norway, Belgium and the …
Brochure Final Control LNG Solutions - Emerson
www.emerson.comthere are challenges to LNG too. Namely, natural gas must be taken to a crisp, consistent -162°C (-260°F) for transport in liquid state, and many reserves are in areas where super freezing isn’t easy or convenient to maintain. As global demand increases, complexity and …
Liquefied Gas Carriers - Ship Types
img2.eworldship.comLiquefied Gas Carriers - Ship Types Profile of the world gas fleet The current fleet of liquefied gas ships in service is approximately 1,100, of which about 800 are LPG carriers, with over 200 LNG carriers and approximately 90 ethylene carriers making up the remainder. Gas carriers are divided into two main groups. • Liquefied Petroleum Gas ...
Natural Gas Documentation 2021
wds.iea.orgBUNKERS Quantities of LNG or natural gas used by ships of all flags that are engaged in international navigation. The international navigation may take place at sea, on inland lakes and water-ways, and in coastal waters. Stock Changes STCHANAT This is the change in stock level of recoverable gas held on
