Transcription of Ultraviolet - Visible Spectroscopy (UV)
1 UV Ultraviolet - Visible Spectroscopy (UV) UVIntroduction to Ultraviolet - Visible Spectroscopy1 (UV) Background TheoryAbsorption of Ultraviolet and Visible radiationAbsorption of Visible and Ultraviolet (UV) radiation is associated with excitation of electrons, in both atoms and molecules, from lower to higher energy levels. Since the energy levels of matter are quantized, only light with the precise amount of energy can cause transitions from one level to another will be absorbed. The possible electronic transitions that light might cause are2: In each possible case, an electron is excited from a full (low energy, ground state) orbital into an empty (higher energy, excited state) anti-bonding Each wavelength of light has a particular energy associated with it.
2 If that particular amount of energy is just right for making one of these electronic transitions, then that wavelength will be absorbed. The larger the gap between the energy levels, the greater the energy required to promote the electron to the higher energy level; resulting in light of higher frequency, and therefore shorter wavelength, being molecules will undergo electronic excitation following absorption of light, but for most molecules very high energy radiation (in the vacuum Ultraviolet , <200 nm) is required. Consequently, absorption of light in the UV- Visible region will only result in the following transitions: Therefore in order to absorb light in the region from 200 - 800 nm (where spectra are measured), the molecule must contain either V bonds or atoms with non-bonding orbitals.
3 A non-bonding orbital is a lone pair on, say, oxygen, nitrogen or a halogen. bonds are formed by sideways overlap of the half-filled p orbitals on the two carbon atoms of a double bond. The two red shapes shown in the diagram below for ethene are part of the same bonding orbital. Both of the electrons are found in the resulting bonding orbital in the ground 2009 Royal Society of Chemistry known as UV- Visible further reading about bonding refer to #topMolecules that contain conjugated systems, alternating single and double bonds, will have their electrons delocalised due to overlap of the p orbitals in the double bonds. This is illustrated below for buta-1, is a well-known example of a conjugated system. The Kekul structure of benzene consists of alternating single double bonds and these give rise to the delocalised V system above and below the plane of the carbon carbon single the amount of delocalisation in the molecule increases the energy gap between the bonding orbitals and anti-bonding orbitals gets smaller and therefore light of lower energy, and longer wavelength, is buta-1,3-diene absorbs light of a longer wavelength than ethene it is still absorbing in the UV region and hence both compounds are colourless.
4 However, if the delocalisation is extended further the wavelength absorbed will eventually be long enough to be in the Visible region of the spectrum, resulting in a highly coloured compound. A good example of this is the orange plant pigment, beta-carotene which has 11 carbon-carbon double bonds conjugated absorbs throughout the UV region but particularly strongly in the Visible region between 400 and 500 nm with a peak at 470 in a molecule which consist of alternating single and double bonds (conjugation) and absorb Visible light are known as metal complexes are also highly coloured, which is due to the splitting of the d orbitals when the ligands approach and bond to the central metal ion. Some of the d orbitals gain energy and some lose energy.
5 The amount of splitting depends on the central metal ion and ligands. The difference in energy between the new levels affects how much energy will be absorbed when an electron is promoted to a higher level. The amount of energy will govern the colour of light which will be absorbed. For example, in the octahedral copper complex, [Cu(H2O)6]2+, yellow light has sufficient energy to promote the d electron in the lower energy level to the higher 2009 Royal Society of Chemistry 2 Ultraviolet - Visible Spectroscopy (UV)Copyright 2009 Royal Society of Chemistry 3 Ultraviolet - Visible Spectroscopy (UV)It is possible to predict which wavelengths are likely to be absorbed by a coloured substance. When white light passes through or is reflected by a coloured substance, a characteristic portion of the mixed wavelengths is absorbed.
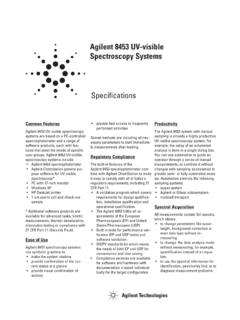
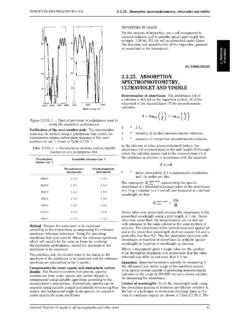
6 The remaining light will then assume the complementary colour to the wavelength(s) absorbed. This relationship is demonstrated by the colour wheel shown on the right. Complementary colours are diametrically opposite each other. UV- Visible spectrometers can be used to measure the absorbance of ultra violet or Visible light by a sample, either at a single wavelength or perform a scan over a range in the spectrum. The UV region ranges from 190 to 400 nm and the Visible region from 400 to 800 nm. The technique can be used both quantitatively and qualitatively. A schematic diagram of a UV- Visible spectrometer is shown above. The light source (a combination of tungsten/halogen and deuterium lamps) provides the Visible and near Ultraviolet radiation covering the 200 800 nm.
7 The output from the light source is focused onto the diffraction grating which splits the incoming light into its component colours of different wavelengths, like a prism (shown below) but more liquids the sample is held in an optically flat, transparent container called a cell or cuvette. The reference cell or cuvette contains the solvent in which the sample is dissolved and this is commonly referred to as the each wavelength the intensity of light passing through both a reference cell (Io) and the sample cell (I) is measured. If I is less than Io, then the sample has absorbed some of the light. The absorbance (A) of the sample is related to I and Io according to the following equation:The detector converts the incoming light into a current, the higher the current the greater the intensity.
8 The chart recorder usually plots the absorbance against wavelength (nm) in the UV and Visible section of the electromagnetic spectrum. (Note: absorbance does not have any units).UV- Visible SpectrometerMONOCHROMATORBEAMSPLITTERSAM PLECELLREFERENCECELLRATIODETECTORSPRISMS OURCERedOrangeYellowGreenBlueVioletUV RegionVisible Region Colour WheelBlueVioletRedOrangeGreenYellow800 nm - Visible Region400 nm190 nm620 nm590 nm570 nm495 nm450 nmIf a substance absorbs appears as this colourRed 620-750 nmOrange 590-620 nmYellow 570-590 nmGreen 496-570 nmBlue 450-495 nmViolet 380-450 nm400 nmRedOrangeYellowGreenBlueVioletUV RegionVisible Region Colour WheelBlueVioletRedOrangeGreenYellow800 nm - Visible Region400 nm190 nm620 nm590 nm570 nm495 nm450 nmIf a substance absorbs appears as this colourRed 620-750 nmOrange 590-620 nmYellow 570-590 nmGreen 496-570 nmBlue 450-495 nmViolet 380-450 nm400
9 NmUV- Visible SpectrumThe diagram below shows a simple UV- Visible absorption spectrum for buta-1,3-diene. Absorbance (on the vertical axis) is just a measure of the amount of light absorbed. One can readily see what wavelengths of light are absorbed (peaks), and what wavelengths of light are transmitted (troughs). The higher the value, the more of a particular wavelength is being absorption peak at a value of 217 nm, is in the ultra-violet region, and so there would be no Visible sign of any light being absorbed making buta-1,3-diene colourless. The wavelength that corresponds to the highest absorption is usually referred to as lambda-max (lmax).The spectrum for the blue copper complex shows that the complementary yellow light is Beer-lambert lawAccording to the Beer-Lambert Law the absorbance is proportional to the concentration of the substance in solution and as a result UV- Visible Spectroscopy can also be used to measure the concentration of a Beer-Lambert Law can be expressed in the form of the following equation.
10 A = eclWhere A = absorbance l = optical path length, dimension of the cell or cuvette (cm)c = concentration of solution (mol dm-3)e = molar extinction, which is constant for a particular substance at a particular wavelength (dm3 mol-1 cm-1)If the absorbance of a series of sample solutions of known concentrations are measured and plotted against their corresponding concentrations, the plot of absorbance versus concentration should be linear if the Beer-Lambert Law is obeyed. This graph is known as a calibration calibration graph can be used to determine the concentration of unknown sample solution by measuring its absorbance, as illustrated the absorbance for dilute solutions is directly proportional to concentration another very useful application for UV- Visible Spectroscopy is studying reaction kinetics.