Transcription of Understanding SWR by Example
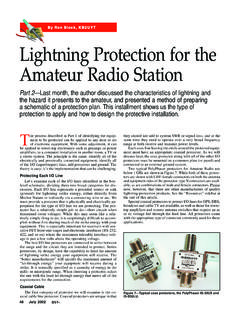
1 From November 2006 QST ARRLIt sometimes seems that one of the most mysterious creatures in the world of Amateur Radio is standing wave ratio (SWR). I often hear on-air discussion of guys brag-ging about and comparing their SWR num-bers as if it were a contest. There seems to be a relentless drive to achieve the most coveted 1:1 SWR at any cost. But why? This article is written to help explain what SWR actually is, what makes it bad and when to worry about it. What is SWR?SWR is sometimes called VSWR, for voltage standing wave ratio, by the technical folks. Okay, but what does it really mean? The best way to easily understand SWR is by Example .
2 In the typical ham station setup, a transmitter is connected to a feed line, which is then connected to the antenna. When you key the transmitter, it develops a radio fre-quency (RF) voltage on the transmission line input. The voltage travels down the feed line to the antenna at the other end and is called the forward wave. In some cases, part of the voltage is reflected at the antenna and propagates back down the line in the reverse direction toward the transmitter, much like a voice echoing off a distant cliff. SWR is a measure of what is happening to the forward and reverse voltage waveforms and how they compare in size. Let s look at what happens when a trans-mitter is connected to 50 coax and a 50 antenna.
3 For now, pretend that the coax cable doesn t have any losses and the transmitter is producing a 1 W CW signal. If you were to look at the signal on the output of the transmitter with an oscilloscope, what you would see is a sine wave. The amplitude of the sine wave would be related to how much power the transmitter is producing. A larger amplitude waves means more power. This wave of energy travels down the transmission line and reaches the antenna. If the antenna impedance is 50 , just like the cable, then all of the energy is transferred to the antenna system to be radiated. Anywhere on the transmission line you measured, the voltage waveform would measure exactly the same as the sine wave coming from the transmitter.
4 This is called a matched condition and is what Understanding SWR by ExampleTake the mystery and mystique out of standing wave Walraven, K5 DVWT able 1 SWR vs Reflected Voltage or PowerVSWR Voltage Power Reflected (%) Reflected (%) :1 0 0 :1 5 :1 9 :1 13 :1 17 :1 20 4 :1 23 :1 26 :1 29 :1 31 :1 33 11 :1 43 :1 50 25 :1 56 36 :1 67 :1 82 67happens with a 1:1 the case of resistive loads (see sidebar), the SWR can be easily calculated as equal to the (Load R)/Z0 or Z0/(Load R), whichever gives a result greater than or equal to load or terminating resistance is the RF resistance of whatever is on the end of the transmission line.
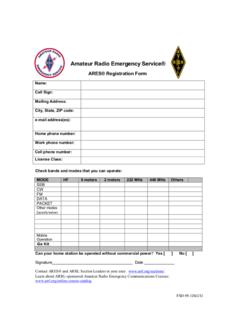
5 It could be an antenna, amplifier or dummy load. The line imped-ance is the characteristic impedance of the transmission line and is related to the physi-cal construction of the line. Conductor size, space between conductors, what plastic was used in the insulation all affect line impedance. Generally, the cable manufac-turer will list the line impedance and there s nothing you, as a user, can do to change , what if the antenna wasn t 50 ? Suppose that the antenna is 100 and the Figure 1 A graph showing the additional loss in a transmission line due to SWR higher than 1 November 2006 QST ARRLIn the main article I used several examples of SWR based on a resistive load.
6 A resistive load is the easiest to visualize, calculate and understand, but it s not the most common type of load. In most cases, loads have some reactive impedance as well. That is, they contain a resistive part and an inductive or capacitive part in combination. For instance, your antenna might appear as a 50 resistor with a 100 nH inductor in series, or perhaps some capacitance to ground. In this situation, the SWR is not 1:1 because of the reactance. Even antennas that show a perfect 1:1 SWR in mid-band will typically have some larger SWR at the band edges, often due to the reactance of the antenna changing with frequency. Fortunately, a given SWR behaves the same on a transmission line whether it s reactive or resistive.
7 If you have a handle on Understanding the resistive case, the concept will get you pretty explore SWR further, it s useful to look at the reactive load case, or what happens under the condition that loads are not simply resistive. Complex imaginary number math is the routine way to analyze the SWR of complex loads and can be done if you have access to a calculator or computer program that will handle it. Even so, the math gets tedious in a hurry. Fortunately, there s a very easy way to analyze complex loads using graphical methods and it s called the Smith Chart. See Figure concept behind the Smith Chart is simple. There is a resistive axis that is down the middle of the chart, left to right, and a reactive axis along the outer edge of the chart s circumference.
8 Inductive loads are plotted in the top half of the graph, and capacitive loads in the bottom. Any value of resistance and reactance in a series combination can be plotted on the chart. Then, with a ruler and compass the SWR can be determined. Advanced users of the chart can plot a load and use graphic techniques to design a matching structure or impedance transformer without rigorous math or com-puter. It s a very powerful tool. Here s a simple Example showing how to determine SWR from a known load using the you have just measured a new antenna with an impedance bridge and you know that the input impedance is 35 in series with 12 reactive. The coax cable feeding it has a Z0 of 50.
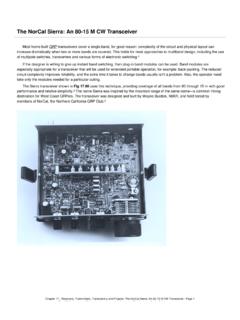
9 What is the SWR at the antenna end of the coax? This impedance can be written as the complex num-ber Z=35 + . The j is used to indicate the reac-tive part from the real part and they can t simply add together. To use a normalized Smith Chart we divide the impedance by 50 , to normalize the impedance. [Smith Charts are also available designed for 50 with 50 at the center instead of the that we show for the normalized chart. Ed.] We now have Z= + Smith Chart numbers are normalized, which means that they have been divided by the system impedance before being plotted. In most cases, the system impedance is the transmission line impedance and is represented on the chart by the dot in the center.
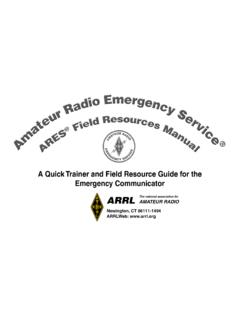
10 Now plot Z on the chart. Along the horizontal line fi nd the marker and move upward (inductors or positive reactances are upward, capacitors or negative reactances are down-Adding Reactance to the PictureFigure A The normalized Smith Chart, ready to simplify transmission line B An impedance of 35 + normalized to + to use on the normalized November 2006 QST ARRLF igure D A line drawn from the chart center through the impedance of Figure B to the edge showing the distance from the pure resistive points on the from center) until you cross the reactance line (see Figure B). Draw a point here that notes your imped-ance of 35 + . Next draw a line from the center dot of the chart to your Z point.