Transcription of User Guide - torontomicrofluidics.ca
1 Document Revision History: PeakForce QNM User GuideRevisionDateSection(s) AffectedRef. DCRA pprovalFJune 3, KelleyEApril 12, , 26,2010 Added Fig. , section KelleyBMarch 03, KelleyAJanuary 22, 2010 Initial ReleaseN/AVinson Kelley004-1036-000 Copyright [2009, 2010, 2011] Bruker CorporationAll rights Guide Notices: The information in this document is subject to change without notice. NO WARRANTY OF ANY KIND IS MADE WITH REGARD TO THIS MATERIAL, INCLUDING, BUT NOT LIMITED TO, THE IMPLIED WARRANTIES OF MERCHANTABILITY AND FITNESS FOR A PARTICULAR PURPOSE. No liability is assumed for errors contained herein or for incidental or consequential damages in connection with the furnishing, performance, or use of this material. This document contains proprietary information which is protected by copyright. No part of this document may be photocopied, reproduced, or translated into another language without prior written : Copyright 2004, 2011 Bruker Corporation.
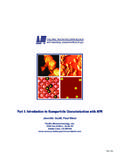
2 All rights reserved. Trademark Acknowledgments: The following are registered trademarks of Bruker Corporation. All other trademarks are the property of their respective Names:NanoScope MultiMode Dimension Dimension Icon BioScope BioScope Catalyst Atomic force Profiler (AFP )Dektak Software Modes:TappingMode Tapping TappingMode+ LiftMode AutoTune TurboScan Fast HSG PhaseImaging DekMap 2 HyperScan StepFinder SoftScan ScanAsyst Peak force Tapping PeakForce QNM Hardware Designs:TrakScan StiffStage Hardware Options:TipX Signal Access Module and SAM Extender TipView Interleave LookAhead Quadrex Software Options:NanoScript Navigator FeatureFind Miscellaneous:NanoProbe Cover Image: Anti-bacterial film consisting of poly(methyl methacrylate) and silver nanoparticles. The sample was imaged on a Dimension Icon using PeakForce QNM at a scan size of m.
3 The data shown is adhesion data overlaid on topography. The dark red spots correspond to the location of silver nanoparticles, which are difficult to identify using topography alone. (Sample courtesy of Mishae Khan and Daniel Bubb, Rut-gers University.)Rev. FPeakForce QNMiiiTable of ContentsList of Figures .. viiChapter 1 Introduction to PeakForce QNM microscopy .. Introduction .. What is in the PeakForce QNM kit? .. Conventions and Definitions .. 2 Chapter 2 PeakForce QNM Operation.. Introduction .. PeakForce QNM Principles of Operation .. Peak force Tapping Mode.. The Heartbeat .. force curves .. PeakForce QNM Probe Selection .. Basic PeakForce QNM Operation .. Select the Microscope.. Configure the Hardware .. Select Mode of Operation.. Head, Cantilever and Sample Preparation.
4 Align Laser .. Adjust Photodetector.. Set Initial Scan Parameters .. Engage.. Image the sample.. PeakForce QNM Channels .. DMT Modulus.. Log DMT Modulus.. Adhesion .. Peak force .. Dissipation.. Deformation .. PeakForce QNM Parameters .. Feedback Parameters.. PeakForce QNM Control Parameters .. Cantilever Parameters.. 29ivPeakForce QNMRev. PeakForce QNM Limits .. Limits Parameters .. Other Parameters.. Parameter Visibility.. Capture Buttons.. Optimizing a ScanAsyst Image.. Advanced Atomic force Operation .. Displaying Parameters.. 40 Chapter 3 PeakForce QNM Samples.. PDMS-Soft-1 .. PDMS-Soft-2 .. Polystyrene .. HOPG .. Fused Silica.. 52 Chapter 4 Calibration .. Introduction to Calibrating PeakForce QNM .. Absolute vs.
5 Relative Calibration Methods .. The Relative Method.. The Absolute Method .. Calibrate the Deflection Sensitivity .. Calibrate the Spring Constant Using Thermal Tuning .. Measure the Tip Radius .. Calibrate Peak force QNM.. Cantilever Parameters .. Feedback Parameters.. 66 Chapter 5 Offline Analysis.. Introduction.. Procedure .. Controls and Settings .. Image Line Selection.. force Curve Selection.. force Curve Type .. Exporting force Curves.. PeakForce QNM Input Parameters.. Exported force Curves .. Time Domain Plots .. Plot Units.. Display Mode .. 79 Rev. FPeakForce Image Math .. 79 Index ..83viPeakForce QNMRev. FRev. FPeakForce QNMviiList of FiguresChapter iiList of Figures ..viiChapter 1 Introduction to PeakForce QNM microscopy .. 1 Chapter 2 PeakForce QNM Operation.
6 3 Figure The heartbeat. Blue indicates approach while red indicates retract.. 4 Figure force curve.. 4 Figure Mode selector switch .. 6 Figure The PeakForce QNM in Air Select Experiment window.. 7 Figure PeakForce QNM in Air (Simple Mode) configuration.. 8 Figure PeakForce QNM in Air (SIMPLE MODE) Parameters Panel.. 10 Figure Suggested PeakForce QNM Channel Settings .. 11 Figure Undock the force Monitor window .. 12 Figure force Monitor window.. 13 Figure Height Image of a PS + LPDE .. 14 Figure force vs. Separation plot .. 15 Figure DMT Modulus map of a PS+LDPE blend .. 16 Figure Adhesion on a PS+LDPE blend .. 17 Figure Adhesion map of a PS+LDPE blend .. 17 Figure The heartbeat, force vs. Time.. 18 Figure force curve, force vs. distance.. 18 Figure Peak force Error map of a PS+LDPE blend.
7 19 Figure Dissipation (shaded area) in a polystyrene (PS) and Low-density polyethylene (LPDE) blend.. 20 Figure Dissipation image of a PS+LDPE blend.. 21 Figure Deformation.. 22 Figure Deformation map of a PS+LDPE blend.. 23 Figure DMT Fit regions of the force curve.. 27 Figure DMT Fit regions of the force curve.. 28 Figure Illustration of PeakForce QNM Limits.. 30 Figure SPM engage step .. 32 Figure CAPTURE LINE button .. 36 Figure High speed data capture is complete. However, the data is not immediately transferred to the .. 37 List of FiguresviiiPeakForce QNMRev. FFigure The heartbeat and force curves of an image before (left) and after (right) AUTO CONFIG .. 38 Figure The AUTO CONFIG button.. 39 Figure The SIMPLE MODE view of the Scan Parameter List for PeakForce QNM in Air .. 40 Figure The EXPANDED MODE view of the Scan Parameter List for ScanAsyst in Air.
8 41 Figure The Configure Experiment information window.. 42 Figure The Configure Experiment Window.. 42 Figure Select SHOW ALL items .. 43 Figure Enable Parameters .. 44 Chapter 3 PeakForce QNM Samples.. 47 Figure Typical force curve of a PDMS-Soft-1 sample .. 48 Figure Typical modulus image of a PDMS-Soft-1 sample .. 48 Figure Typical force curve of a PDMS-Soft-2 sample .. 49 Figure Typical modulus image of a PDMS-Soft-2 sample.. 49 Figure Typical force curve of a Polystyrene sample.. 50 Figure Typical modulus image of a Polystyrene sample .. 50 Figure Typical force curve of a HOPG sample.. 51 Figure Typical modulus image of a HOPG sample .. 51 Chapter 4 Calibration .. 53 Figure Modulus ranges covered by various probes. The modulus of the reference sample for each range is indicated as well.
9 54 Figure The PeakForce QNM in Air Select Experiment window .. 56 Figure force Curve Cursors .. 58 Figure Deflection Sensitivity Dialogue Box.. 58 Figure Select Thermal Tune Frequency Range .. 59 Figure The Thermal Tune panel .. 60 Figure Median Filter Width .. 61 Figure Spring Constant Calculation Result.. 62 Figure Plane Fit of the Characterizer Sample.. 63 Figure Typical force curve of a PDMS-Soft-1 sample. Nominal modulus: MPa.. 64 Figure Tip Qualification Results.. 65 Figure The Cantilever Parameters panel .. 66 Chapter 5 Offline Analysis .. 69 Figure The QNM Hsdc force Curve-Image window.. 70 Figure The HEIGHT channel of the image file .. 71 Figure Vertical cursors display X position .. 72 Figure The QNM Hsdc force Curve-Image window .. 73 Figure PeakForce QNM Controls.
10 74 List of FiguresRev. FPeakForce QNMixFigure Multiple force Curve Selection .. 75 Figure Exported force curve.. 77 Figure force vs. time .. 78 Figure force vs. separation.. 79 Figure Young s modulus in a multilayer polymer optical film before correction.. 80 Figure Young s modulus in a multilayer polymer optical film after Image Math correction .. 80 Figure The Image Math interface.. 81 Figure The Image Math equation.. 81 Chapter 6 Index ..83 List of FiguresxPeakForce QNMRev. FRev. FPeakForce QNM 1 Chapter 1 Introduction to PeakForce QNM QNM (Quantitative NanoMechanics), an extension of Peak force TappingTM mode, enables quantitative measurement of nano-scale material properties such as modulus, adhesion, deformation and dissipation. Because Peak force Tapping Mode controls the force applied to the sample by the tip, sample deformation depths are small and the effect of the substrate on the measured modulus is QNM can provide compositional mapping of a complex composite material while providing equal or higher resolution than a TappingMode image (~5nm).