Transcription of Using R: Frequency Distributions, Histograms, Scatterplots ...
1 1 Using R: Frequency Distributions, Histograms, Scatterplots , & Line GraphsThis document describes how to accomplish the following tasks. Making a Frequency Tabletable(data)2 Here we create a Frequency table from raw data imported from a .CSV file. We also see how to appenda relative and cumulative Frequency table to the original Frequency table. Making Histogramshist(data)4 Here use thehistcommand to make a fast and dirty histogram and demonstrate how to add somebells and whistles. Making Scatterplotsplot(x-data, y-data)5 Using theplotcommand. Making Line Graphs and Time Series Plotplot(time-data, y-data)6 Using theplotcommand when thex-values are we use to correctly read dates.
2 Entering Data Making a Data List (vector)list-name <- c(#, #, #, .., #)7 Making a Table (matrix)table-name <- matrix( ..)7 Importing Data from a CSV File8table-name <- (file=" ", ..)ortable-name <- (" ",header=TRUE,sep=",")2 Frequency Tables in R:In the textbook, we took 42 test scores for male students and put the resultsinto a Frequency on Test #2 - Males42 Scores: Average = Data becomes OrganizedMalesScoresFrequency30 - 39140 - 49350 - 59560 - 69970 - 79680 - 891090 - 998 Then we created a relative and cumulative Frequency table from :MalesScoresFrequency30 - 39140 - 49350 - 59560 - 69970 - 79680 - 891090 - 998 RelativeFrequencyDistribution:MalesRelat iveScoresFrequency30.
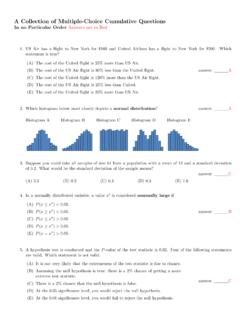
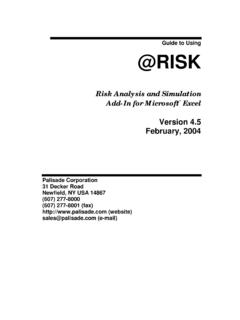
3 MalesCumulativeScoresFrequencyless than 401less than 504less than 609less than 7018less than 8024less than 9034less than 10042 Here we see how to do these tasks with R. We ll start by importing the data into R. Suppose the datais in an Excel file saved as a .CSV file looks likeThis is imported into R Using >malefemaledata <- (" ",header=TRUE,sep=",")>malescores <- malefemaledata$Males3 Here we have R create a Frequency table and then append a relative and cumulative table to in red is typed by the user. Everything in blue is output to the console. The classes are defined by creating a list of class boundaries.
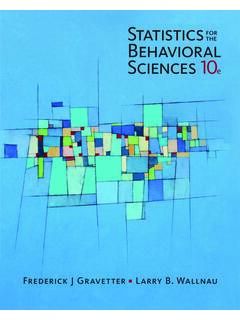
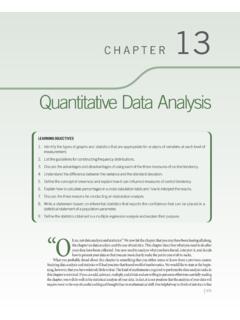
4 You can create this list by hand or>bins <- seq( , ,by=10)Theseqfunction creates a list by starting at and increasing by 10 until it hits [ , , , , , , , ]. Thecutfunction organizes the data into the appropriate bins. Thetransformfunction puts the tables into column format - which is Histograms in R:In the text, we created a histogram from the raw on Test #2 - Males42 Scores: Average = Data becomes HistogramHere, we ll let R create the histogram Using thehistcommand. You can define your own classes bycreating a list of class boundaries and Using thebreaks =command. You can also add a title (main =),a label (xlab =), and color (col =).
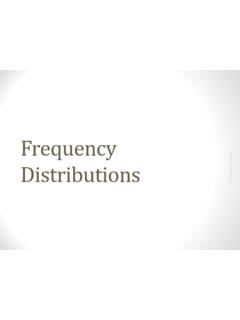
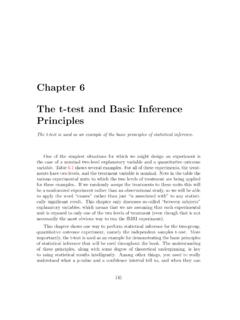
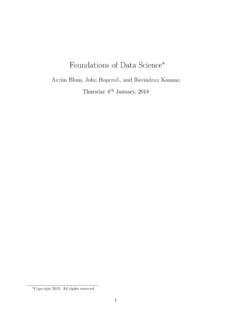
5 5 Scatterplots in R:Suppose we have data for cricket chirps per minute and temperature in degrees Fahrenheit in an Excelfile saved in .CVS format that looks likeWe have R create a scatterplot with theplot(x,y)command and put in the line of best fit with scatterplot:Some customization and a line of best fit:6 Line Graphs and Time Series Graphs in R:A line graph is just a scatterplot where the points are connected moving left to right. Getting the pointsconnected is done Using thetypecommand.>plot(x-data,y-data,type= "o")This now puts a small circle at each point and then connects the points with a line. Anytypewillresult in the points being connected with a time series graph is a line graph where thex-axis represents time.
6 If you are doing a time series withclock time (seconds, minutes, hours), you just create a line graph with the appropriate time units onthex-axis. The tricky part is handling dates. Suppose you have your dates in an Excel spreadsheetsaved as a CSV file like the one below. In this example we look at the unemployment rates from July2008 - July 2009 (the first 12 months after the financial collapse of 2007).The trick is to tell R how to read the date data by>data<- (" ",header=TRUE,sep=",")>month<- (data$Date, "%m/%d/%Y")We have R create a time series graph with theplot Making a Data List (vector):When entering data you must use the syntax below.
7 >Mon <- c(68, 84, 93, 68, 70) Here,Monis the name of the list (you get to choose this name). Then, you have the less than sign from the keyboard followed by the dash ( - ) symbol. All lists must be enclosed withc( #, #, #, .. ). I think thecstands for combine . Don t forget to separate the data values with commas. Making a Table (matrix):Suppose you want to make a table of 5-numbers for each of the first threedays of the Tuesday Wednesday685955847266937877689188709099 You can combine lists like the one described above into a table Using thematrixcommand. Settingthis up takes a little effort and the usage is depicted in the screenshot on the next page.
8 Everything inred is typed by the user. Everything in blue is output to the Importing Data:Since all of the other software packages will easily convert a data file into a CSVfile, we will use this format to read the data intoR. The screenshot below depicts how to read such afile and display the contents. Thehead=TRUE means the first row contains column headings (not data).