
A Beginner’s Guide - PerkinElmer
Analysis (TGA) A Beginner’s Guide This booklet provides an introduction to the concepts of Thermogravimetric Analysis (TGA). It is written for scientists unfamiliar with TGA. The Thermogravimetric Analyzer (TGA) is an essential laboratory tool used for material characterization. TGA is used as a technique to characterize materials used in various
Download A Beginner’s Guide - PerkinElmer
Information
Domain:
Source:
Link to this page:
Documents from same domain
Lambda 650, 800, and 950, Spectrophotometers
resources.perkinelmer.comsensitivity UV/Vis and NIR detectors for demanding transmission measurements on liquids and solids. See inside spread for details. The dual compartments in the LAMBDA Series are the largest in the industry. The primary compartment is used for a wide range of standard reflectance and transmission accessories and polarizers, while the
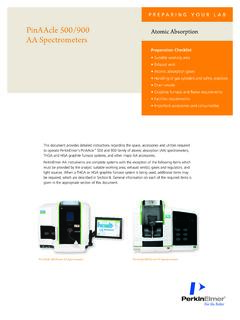
PinAAcle 500/900 AA Spectrometers - PerkinElmer
resources.perkinelmer.comAA spectrometers are normally installed on laboratory work benches or tables. The benchtop or area in which the AA instrument is to be installed should be large enough to accommodate the instrument and all accessories (dimensions of those items are given in Section 10). A custom PinAAcle heavy-duty rolling bench, with locking
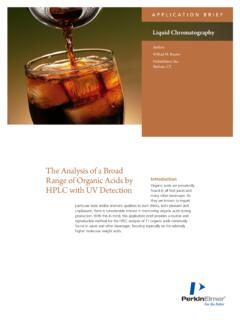
The Analysis of a Broad Range of Organic Acids by HPLC ...
resources.perkinelmer.comThe Analysis of a Broad Range of Organic Acids by HPLC with UV Detection Author: PerkinElmer Inc. Subject: This application brief provides a routine and reproducible method for the HPLC analysis of 11 organic acids commonly found in juices and other beverages. Keywords
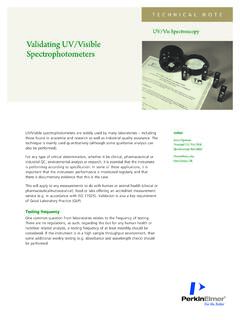
Validating UV/Visible Spectrophotometers
resources.perkinelmer.comtechnique is mainly used quantitatively (although some qualitative analysis can also be performed). For any type of critical determination, whether it be clinical, pharmaceutical or ... which gives far UV wavelengths between 201 nm and 253 nm. Holmium oxide quartz 279.2 nm 360.9 nm 453.7 nm 536.5 nm 637.7 nm Holmium perchlorate solution 241.15 ...
Sensitivity, Background, Noise, and Calibration in Atomic ...
resources.perkinelmer.comthe signal is small relative to the background. It is common to express the relationship between signal and background as the “signal-to-background ratio” or S/B. (This is often referred to as “signal-to-noise” or S/N, but background and noise are two distinct characteristics). The above example would have an S/B of 0.1.
A Beginner’s Guide Introduction - PerkinElmer
resources.perkinelmer.comBoth styles take advantage of gravity to obtain ... TGA 8000 and the TGA 4000 are controlled by PerkinElmer’s proprietary thermal software, Pyris Software, and have autosampler accessories for unattended operation. ... As a new TGA user, it is best to check calibration .
Analysis of Wastewater for Metals using ICP-OES
resources.perkinelmer.comabsorption spectroscopy (AAS), inductively coupled plasma optical emission spectroscopy (ICP-OES) and ICP mass spectrometry (ICP-MS). Depending upon the number of elements that need to be determined and the number of samples that need to be run, the most suitable technique for business requirements can be chosen.
Determination of Relative Fluorescence Quantum Yields ...
resources.perkinelmer.comrequires knowledge of the refractive index of the solvent, and the absorbance of both reference and sample. The relative method provides good accuracy for solution phase samples (as it uses the gradients to calculate the ΦF), with the added benefit of not requiring an integrating sphere.8 The fundamental principle of the comparative method is that
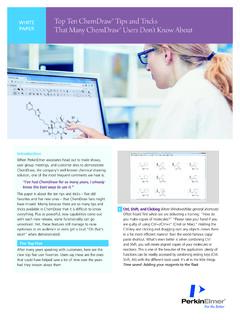
WHITE Top Ten ChemDraw® Tips and Tricks That Many …
resources.perkinelmer.coma high-quality software application to process NMR and LC/MS, GC/MS data. A key aspect Mnova users enjoy is the ability to copy/paste ChemDraw structures onto their NMR spectra as annotations. 7 HELM Libraries (ChemDraw 17.0 and 18.0) ChemDraw is not only about small molecules. ChemDraw 13 introduced the Biopolymer toolbar, which enabled users to
A Beginner's Guide - PerkinElmer
resources.perkinelmer.comA For the vast majority of simple applications, the data from both types of instruments are comparable and both instruments can provide good data. However, both designs have strengths and weaknesses, and if you are doing more than just looking at simple glass transitions and melts, you may need one or the other. Some of the differences are
Related documents
1/2000 - University of Cincinnati
www.eng.uc.eduMETTLER TOLEDO thermal analysis systems 1/2000 Contents TA TIP – Interpreting DSC curves; Part 1: Dynamic measurements NEW in our sales program – DSC822e Applications – The glass transition from the point of view of DSC measurements; Part 2: Information for the character-ization of materials – Thermal values of fats: DSC analysis
Materials Characterization by Thermal Analysis (DSC & …
www.tainstruments.comMaterials Characterization by Thermal Analysis (DSC & TGA), Rheology, and Dynamic Mechanical Analysis Charles Potter – Thermal Application Scientist

Interpreting DSC Data - UC Santa Barbara
www.mrl.ucsb.eduInterpreting DSC Data 2 Anatomy of a Peak A DSC event peak typically contains the following components: • Baseline: This is the expected signal (or change in signal) if no transition event occurs (e.g. if the enthalpy change of melting or H fusion were zero). This is …
CSIR-NATIONAL CHEMICAL LABORATORY Dr. Homi Bhabha …
recruit.ncl.res.inaspects of materials synthesis, characterization, and research in new applications in sensors ... (MFI), differential scanning calorimetry (DSC), optical microscopy, thermo-gravimetric analysis (TGA), gel permeation chromatography (GPC), ... thermal and mechanical characterization studies and undertake experiments related to polymer formulation ...