About the Tutorial
About the Tutorial Microsoft Excel is a commercial spreadsheet application, written and distributed by Microsoft for Microsoft Windows and Mac OS X. At the time of writing this tutorial the Microsoft excel version was 2010 for Microsoft Windows and 2011 for Mac OS X. Microsoft Excel is a spreadsheet tool capable of performing calculations ...
Download About the Tutorial

Information
Domain:
Source:
Link to this page:
Documents from same domain
About the Tutorial
www.tutorialspoint.comPython Assignment Operators ..... 34
Audience - tutorialspoint.com
www.tutorialspoint.comC++ iii Variable Definition in C++ .....15
About The Tutorial
www.tutorialspoint.comi About The Tutorial C is a general-purpose, procedural, imperative computer programming language developed in 1972 by Dennis M. Ritchie at …
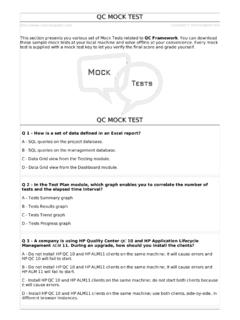
QQCC MMOOCCKK TTEESSTT - Tutorials Point
www.tutorialspoint.comB - 1 2 and 3 only C - 1 3 and 5 only D - 2 4 and 6 only Q 12 - In accordance with best practice, what should you do before logging a new defect? A - Assign a defect ID.

Java - tutorialspoint.com
www.tutorialspoint.comJava i About the Tutorial Java is a high-level programming language originally developed by Sun Microsystems and released in 1995. Java runs on a variety of platforms, such as Windows, Mac OS, and the

Unix - Tutorials Point
www.tutorialspoint.comUnix i About the Tutorial Unix is a computer Operating System which is capable of handling activities from multiple users at the same time. The development of Unix started around 1969 at AT&T Bell Labs
About the Tutorial - Current Affairs 2018, Apache …
www.tutorialspoint.comi About the Tutorial CSS is used to control the style of a web document in a simple and easy way. CSS stands for Cascading Style Sheets. This tutorial covers both the versions CSS1 and CSS2 and

About the Tutorial
www.tutorialspoint.comAbout the Tutorial Python is a general-purpose interpreted, interactive, object-oriented, and high-level programming language. It was created by Guido van Rossum during 1985 – 1990.

R Programming - tutorialspoint.com
www.tutorialspoint.comR Programming i About the Tutorial R is a programming language and software environment for statistical analysis, graphics representation and reporting.

WordPress - Tutorials Point
www.tutorialspoint.comWordPress i About the Tutorial WordPress is an open source Content Management System (CMS), which allows the users to build dynamic websites and blog. WordPress is the most popular blogging system
Related documents

USING EXCEL SOLVER IN OPTIMIZATION PROBLEMS
archives.math.utk.eduwe demonstrate how to use Excel spreadsheet modeling and Solver to find the optimal solution of optimization problems. If the model has two variables, the graphical method can …
RESAMPLING USING EXCEL IN TEACHING STATISTICS
archives.math.utk.edu3. Sampling Distribution Using Excel Data Table Now we use Excel Data Table to generate the sampling distribution of mean and introduce the concepts.
Formulas & Functions in Microsoft Excel
biostat.mc.vanderbilt.eduExcel is a great tool to use for data collection and entry, and even to use for some derivation of other columns. However, Excel IS NOT the best tool to use to conduct advanced analyses, especially statistical analyses.

Creating a Gradebook in Excel
eds-courses.ucsd.eduCreating a Gradebook in Excel Spreadsheets are a great tool for creating gradebooks. With a little bit of work, you can create a customized gradebook that will provide weighted scores and averages. The following instructions describe the steps for creating a spreadsheet gradebook.

How to Use Excel for Data Entry - University of California ...
eds-courses.ucsd.eduExcel is a very popular tool for entering and manipulating data. This document shows you how to enter data that you can easily open in statistics packages such as SPSS or SAS.
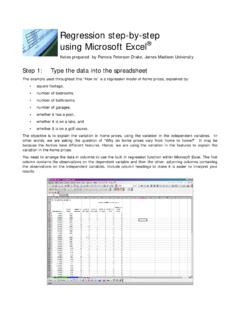
Regression step-by-step using Microsoft Excel
educ.jmu.eduStep 2: Use Excel®’s Data Analysis program, Regression In the Tools menu, you will find a Data Analysis option.1 Within Data Analysis, you should then choose Regression: Step 3: Specify the regression data and output You will see a pop-up box for the regression specifications.
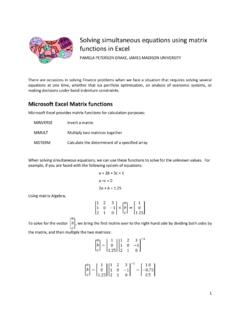
Solving simultaneous equations using matrix functions in Excel
educ.jmu.eduMicrosoft Excel provides matrix functions for calculation purposes: MINVERSE Invert a matrix MMULT Multiply two matrices together MDTERM Calculate the determinant of a specified array When solving simultaneous equations, we can use these functions to solve for the unknown values. For
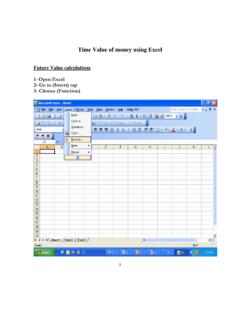
Time Value of money using Excel - KFUPM
faculty.kfupm.edu.saTime Value of money using Excel Future Value calculations 1- Open Excel 2- Go to (Insert) tap 3- Choose (Function) 2 4- In the (insert function) box ... When the function argument box open, use the cell selector button to choose the relevant variables. 20 For cash …

Using Excel to Graph a Function - San Dieguito Union High ...
math.sduhsd.netUsing Excel to Graph a Function 1. Make the x-values. a. Type x in cell A1. b. Type 1 in cell A2 and type 2 in cell A3. c. Select cells A2 and A3 by clicking-and-dragging. Select the “formula drag” point in the lower right corner of the selection and drag this down until you have the values 1 through 15 showing.
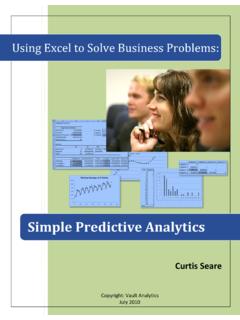
Using Excel to Solve Business Problems - AI Applications
vaultanalytics.comPreparing to Use Excel 2007 Excel 2007 is used in the specific ‘How To’ sections, as it is the most ubiquitous piece of software with statistical capabilities.
Related search queries
USING EXCEL SOLVER IN OPTIMIZATION PROBLEMS, How to use Excel, RESAMPLING USING EXCEL IN TEACHING STATISTICS, Excel, Use Excel, Formulas & Functions in Microsoft Excel, Creating a Gradebook in Excel, How to Use Excel for Data Entry, Using Excel to Graph a Function, Using Excel to Solve Business Problems